Solana Price Forecast: SOL ranks in the top 3 chains by revenue, gears up for gains

Solana price today: $166.73
- Solana price hovers just below a key resistance level at $171.
- SOL chain ranks in the top three by revenue in Q3 2024, at $54.7 million.
- Solana’s native token could gain nearly 11% and test resistance at $184.89.
Solana (SOL) price edges slightly lower and trades at $166.73 at the time of writing on Tuesday after being rejected from Monday’s high of $171.76. The token of the Ethereum alternative blockchain is hovering just below $171, a resistance level tested only once in nearly two months.
On Tuesday, Pump.fun, a launchpad for meme coins on the Solana blockchain, announced its plans for a token release in the future and added a new feature to its platform. Pump.fun has come up with a new trading terminal, “Pump Advance,” and made an official announcement on X in a spaces event on Saturday.
Solana ranks in top 3 blockchains by revenue in Q3 2024
Solana is third, following Ethereum and Tron, in terms of blockchain revenue in Q3 this year. SOL generated $54.7 million in revenue in the third quarter, pushing the chain to the top three spot, according to data from CryptoRank.io.
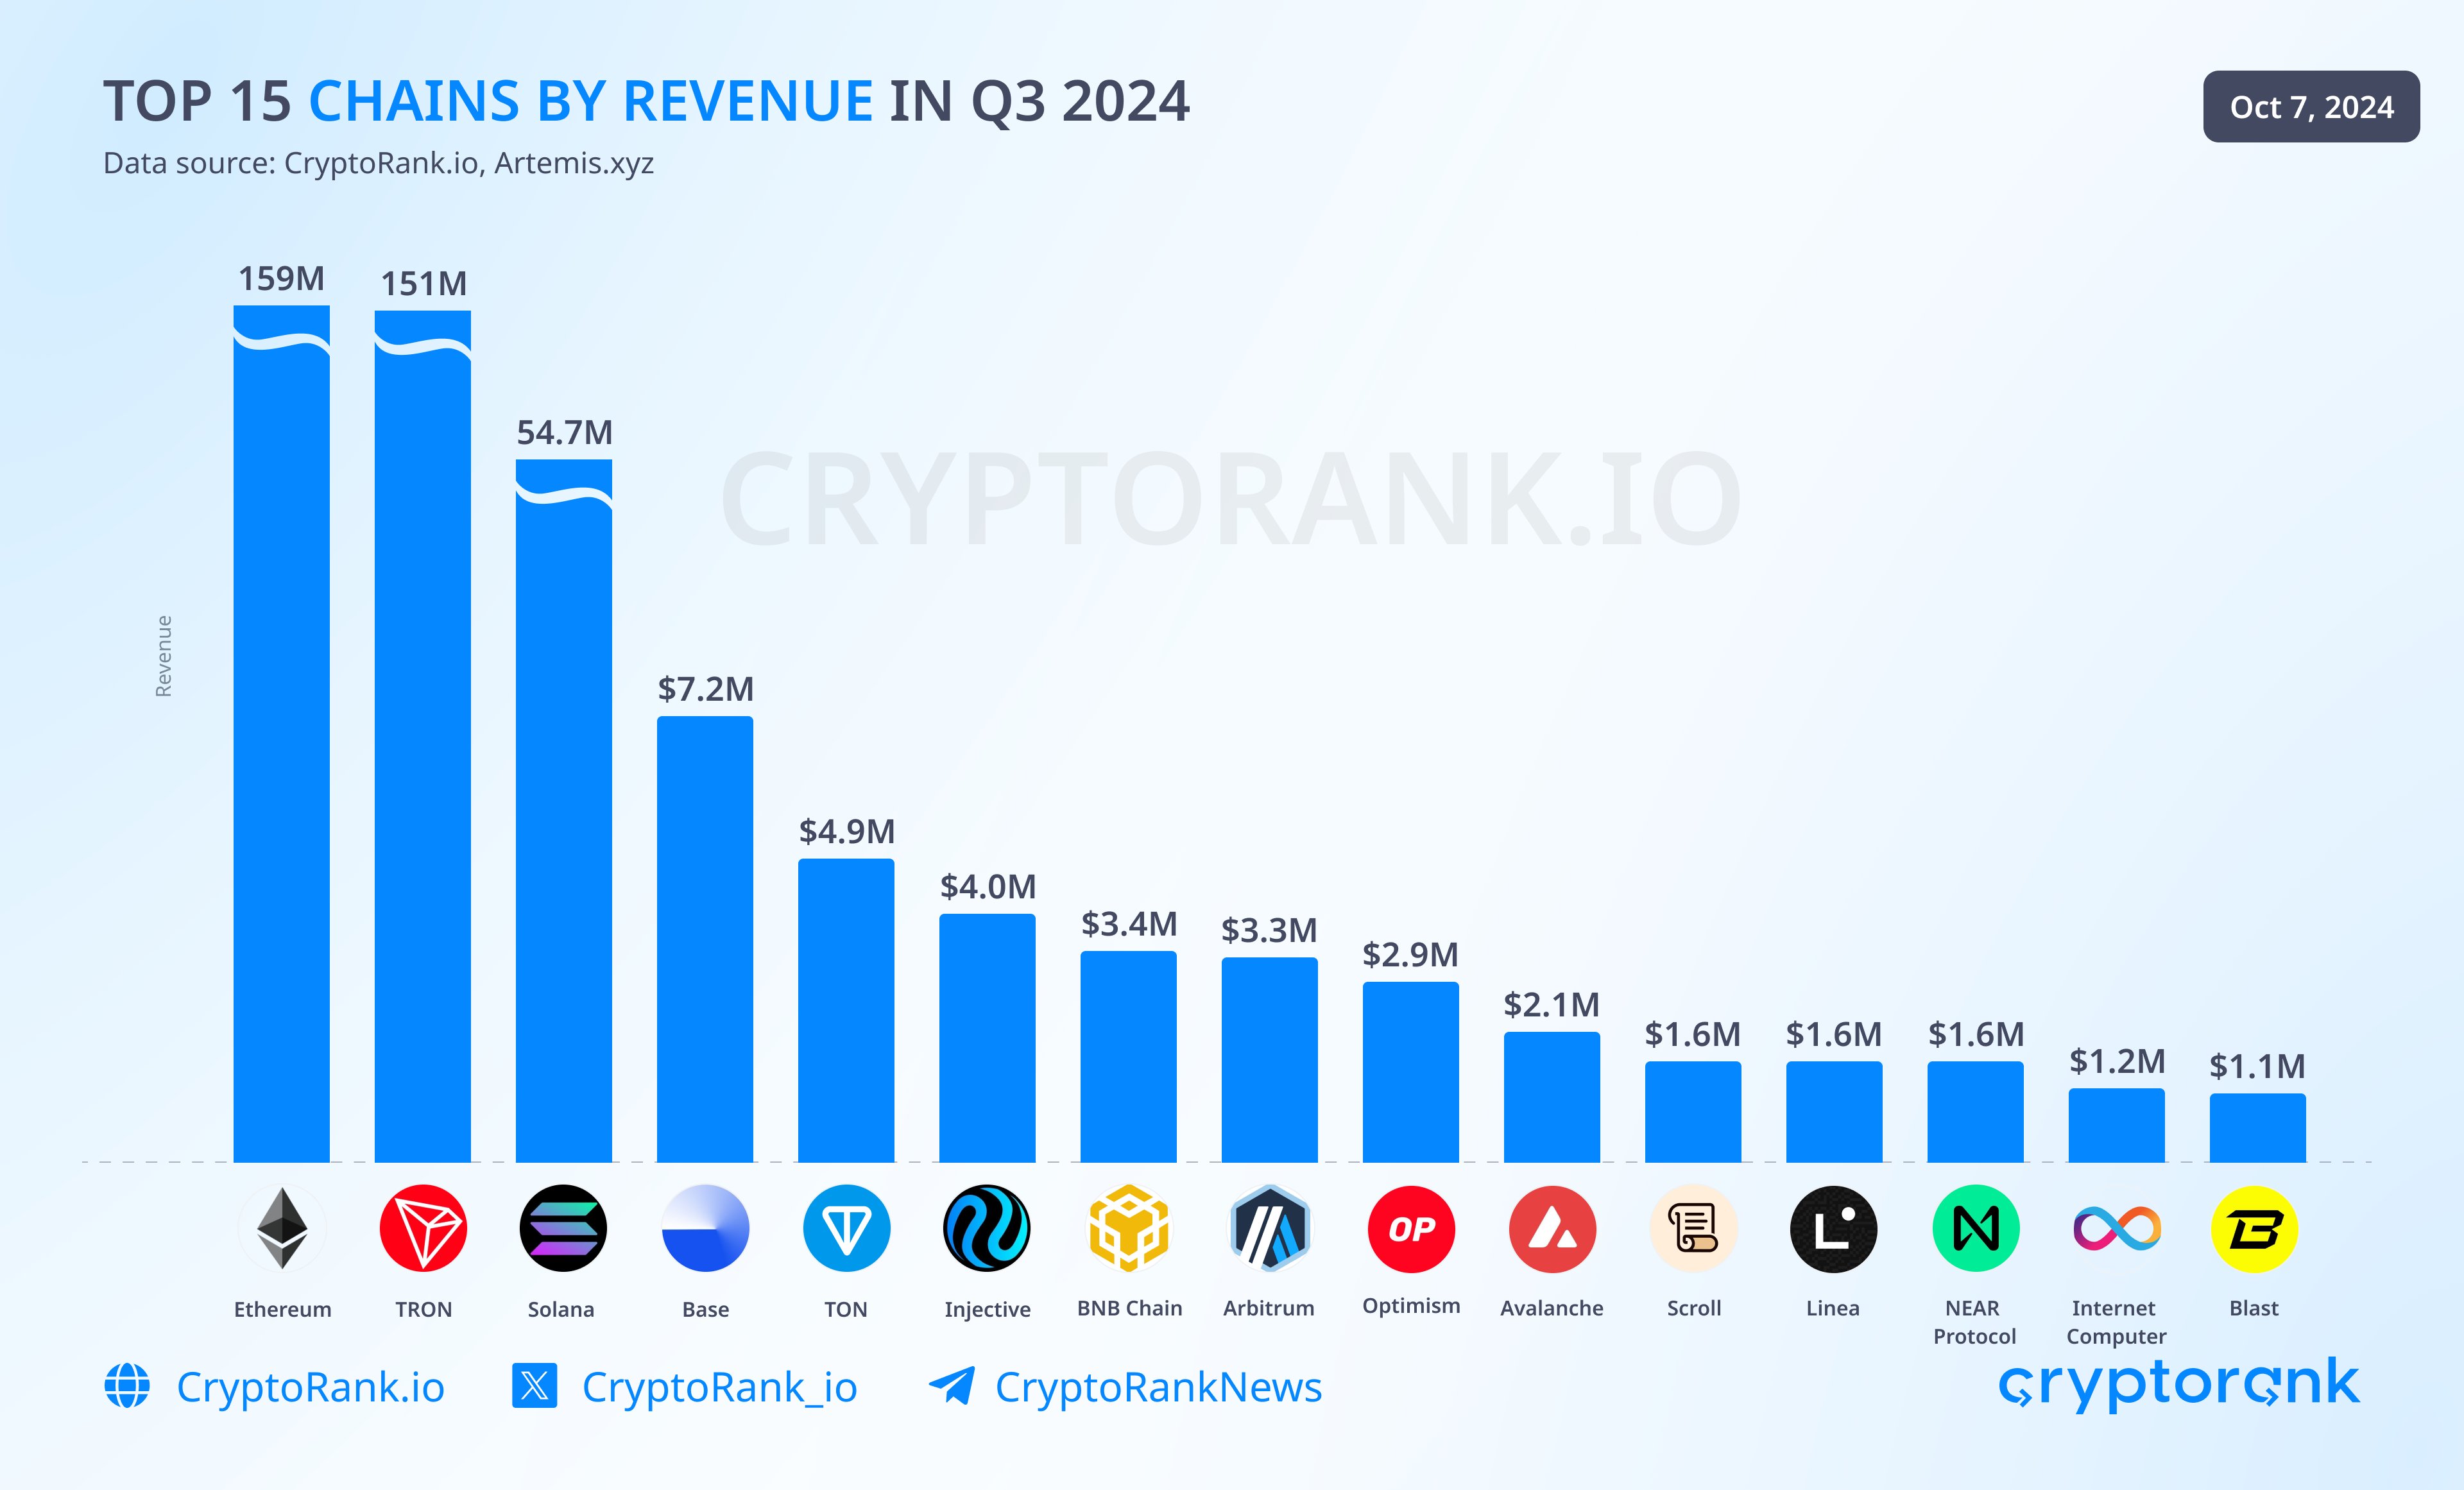
Top 15 crypto chains by revenue in Q3 2024
On Tuesday, Solana welcomed the Elmnts protocol on its chain. The project tokenizes investment funds backed by oil and gas royalties on Solana.
Welcome @elmnts_ — tokenizing investment funds backed by oil and gas royalties on Solana ⛽
— Solana (@solana) October 22, 2024
Try out their public beta, now live! pic.twitter.com/K172Ju9MmR
Throughout Q3 2024, Solana captured market share as the second largest cryptocurrency, while Ethereum noted a decline in the same timeframe. CoinGecko’s Q3 2024 report, published on October 14, shows a spike in trading activity on decentralized exchanges based on Solana, alongside meme coin activity.
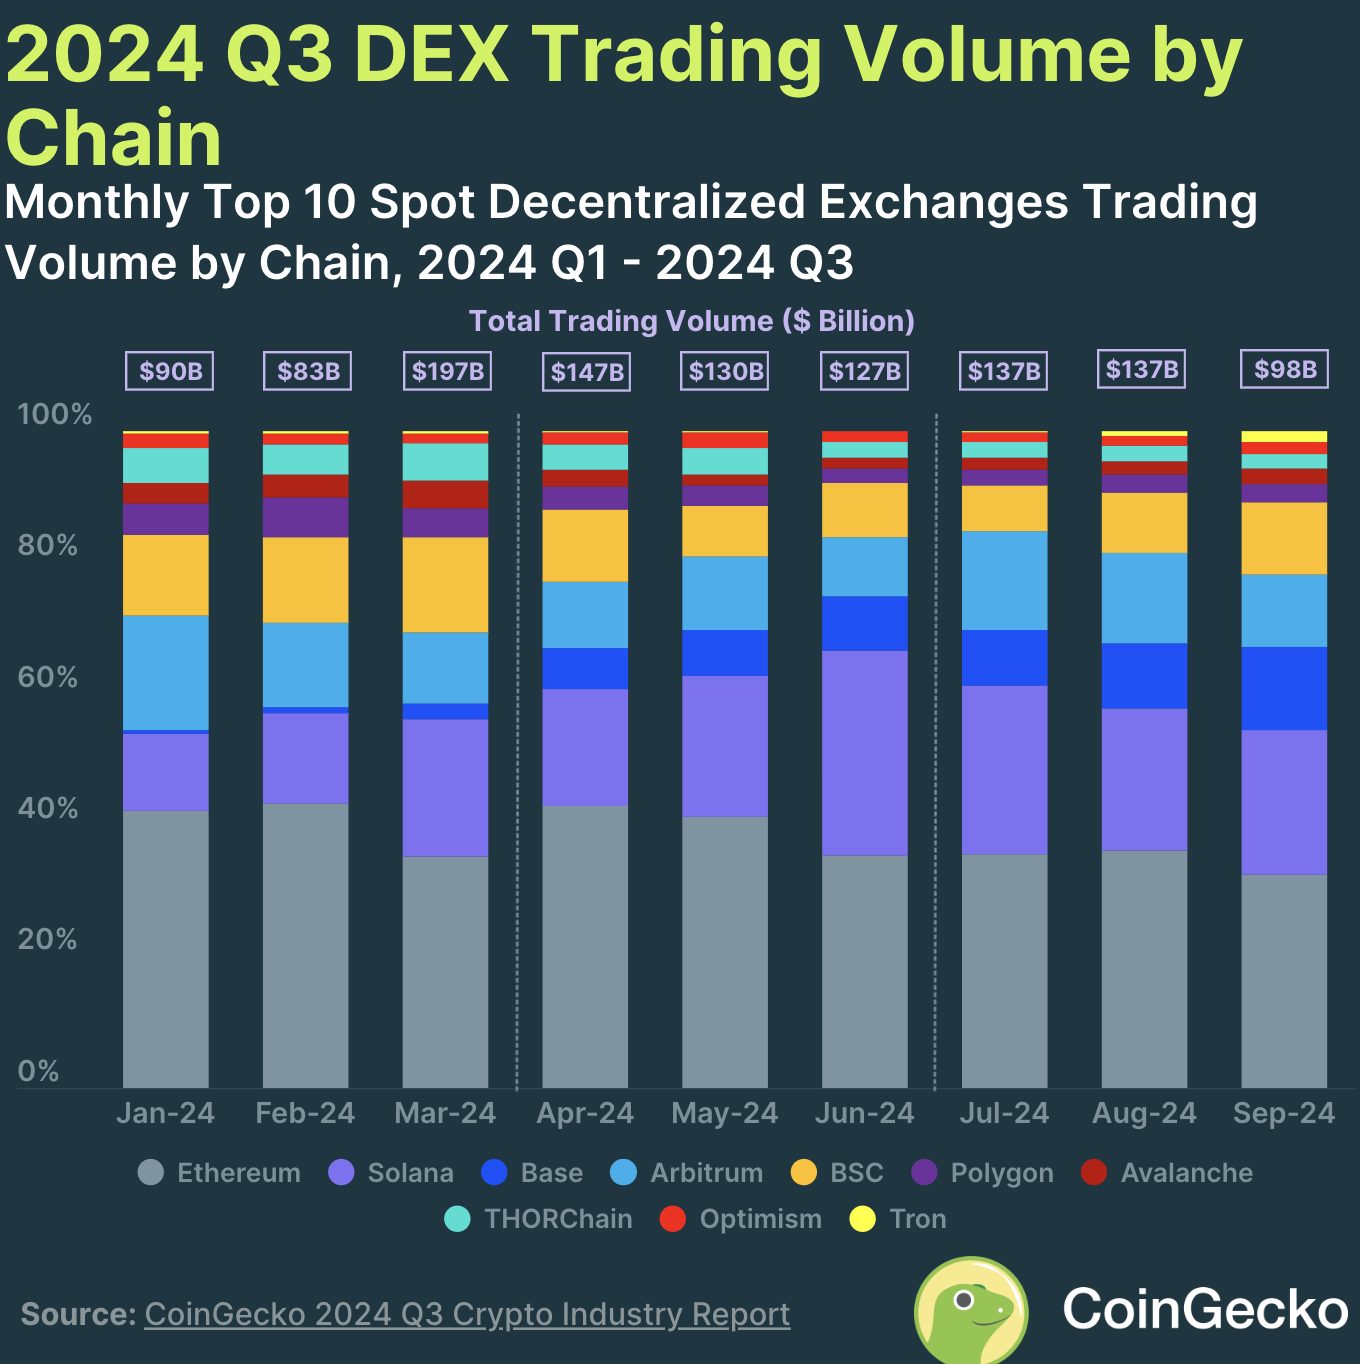
Q3 DEX Trading Volume according to blockchain per CoinGecko report
Solana Price Forecast: SOL eyes 11% gains
Solana has been on an upward trend, forming higher highs and higher lows since early September, as seen in the SOL/USDT daily chart below. SOL could gain 11% and rally towards $184.89, the August high and a resistance level that has not been tested in over two months.
SOL faces intermediate resistance at the two imbalance zones between $172.91 and $175.39 and between $169.43 and $171.61.
The Moving Average Convergence and Divergence (MACD) indicator flashes green histogram bars above the neutral line, signalling SOL price trend has an underlying positive momentum. Meanwhile, the Awesome Oscillator (AO) indicator shows green bars, showing SOL has the potential for additional gains.
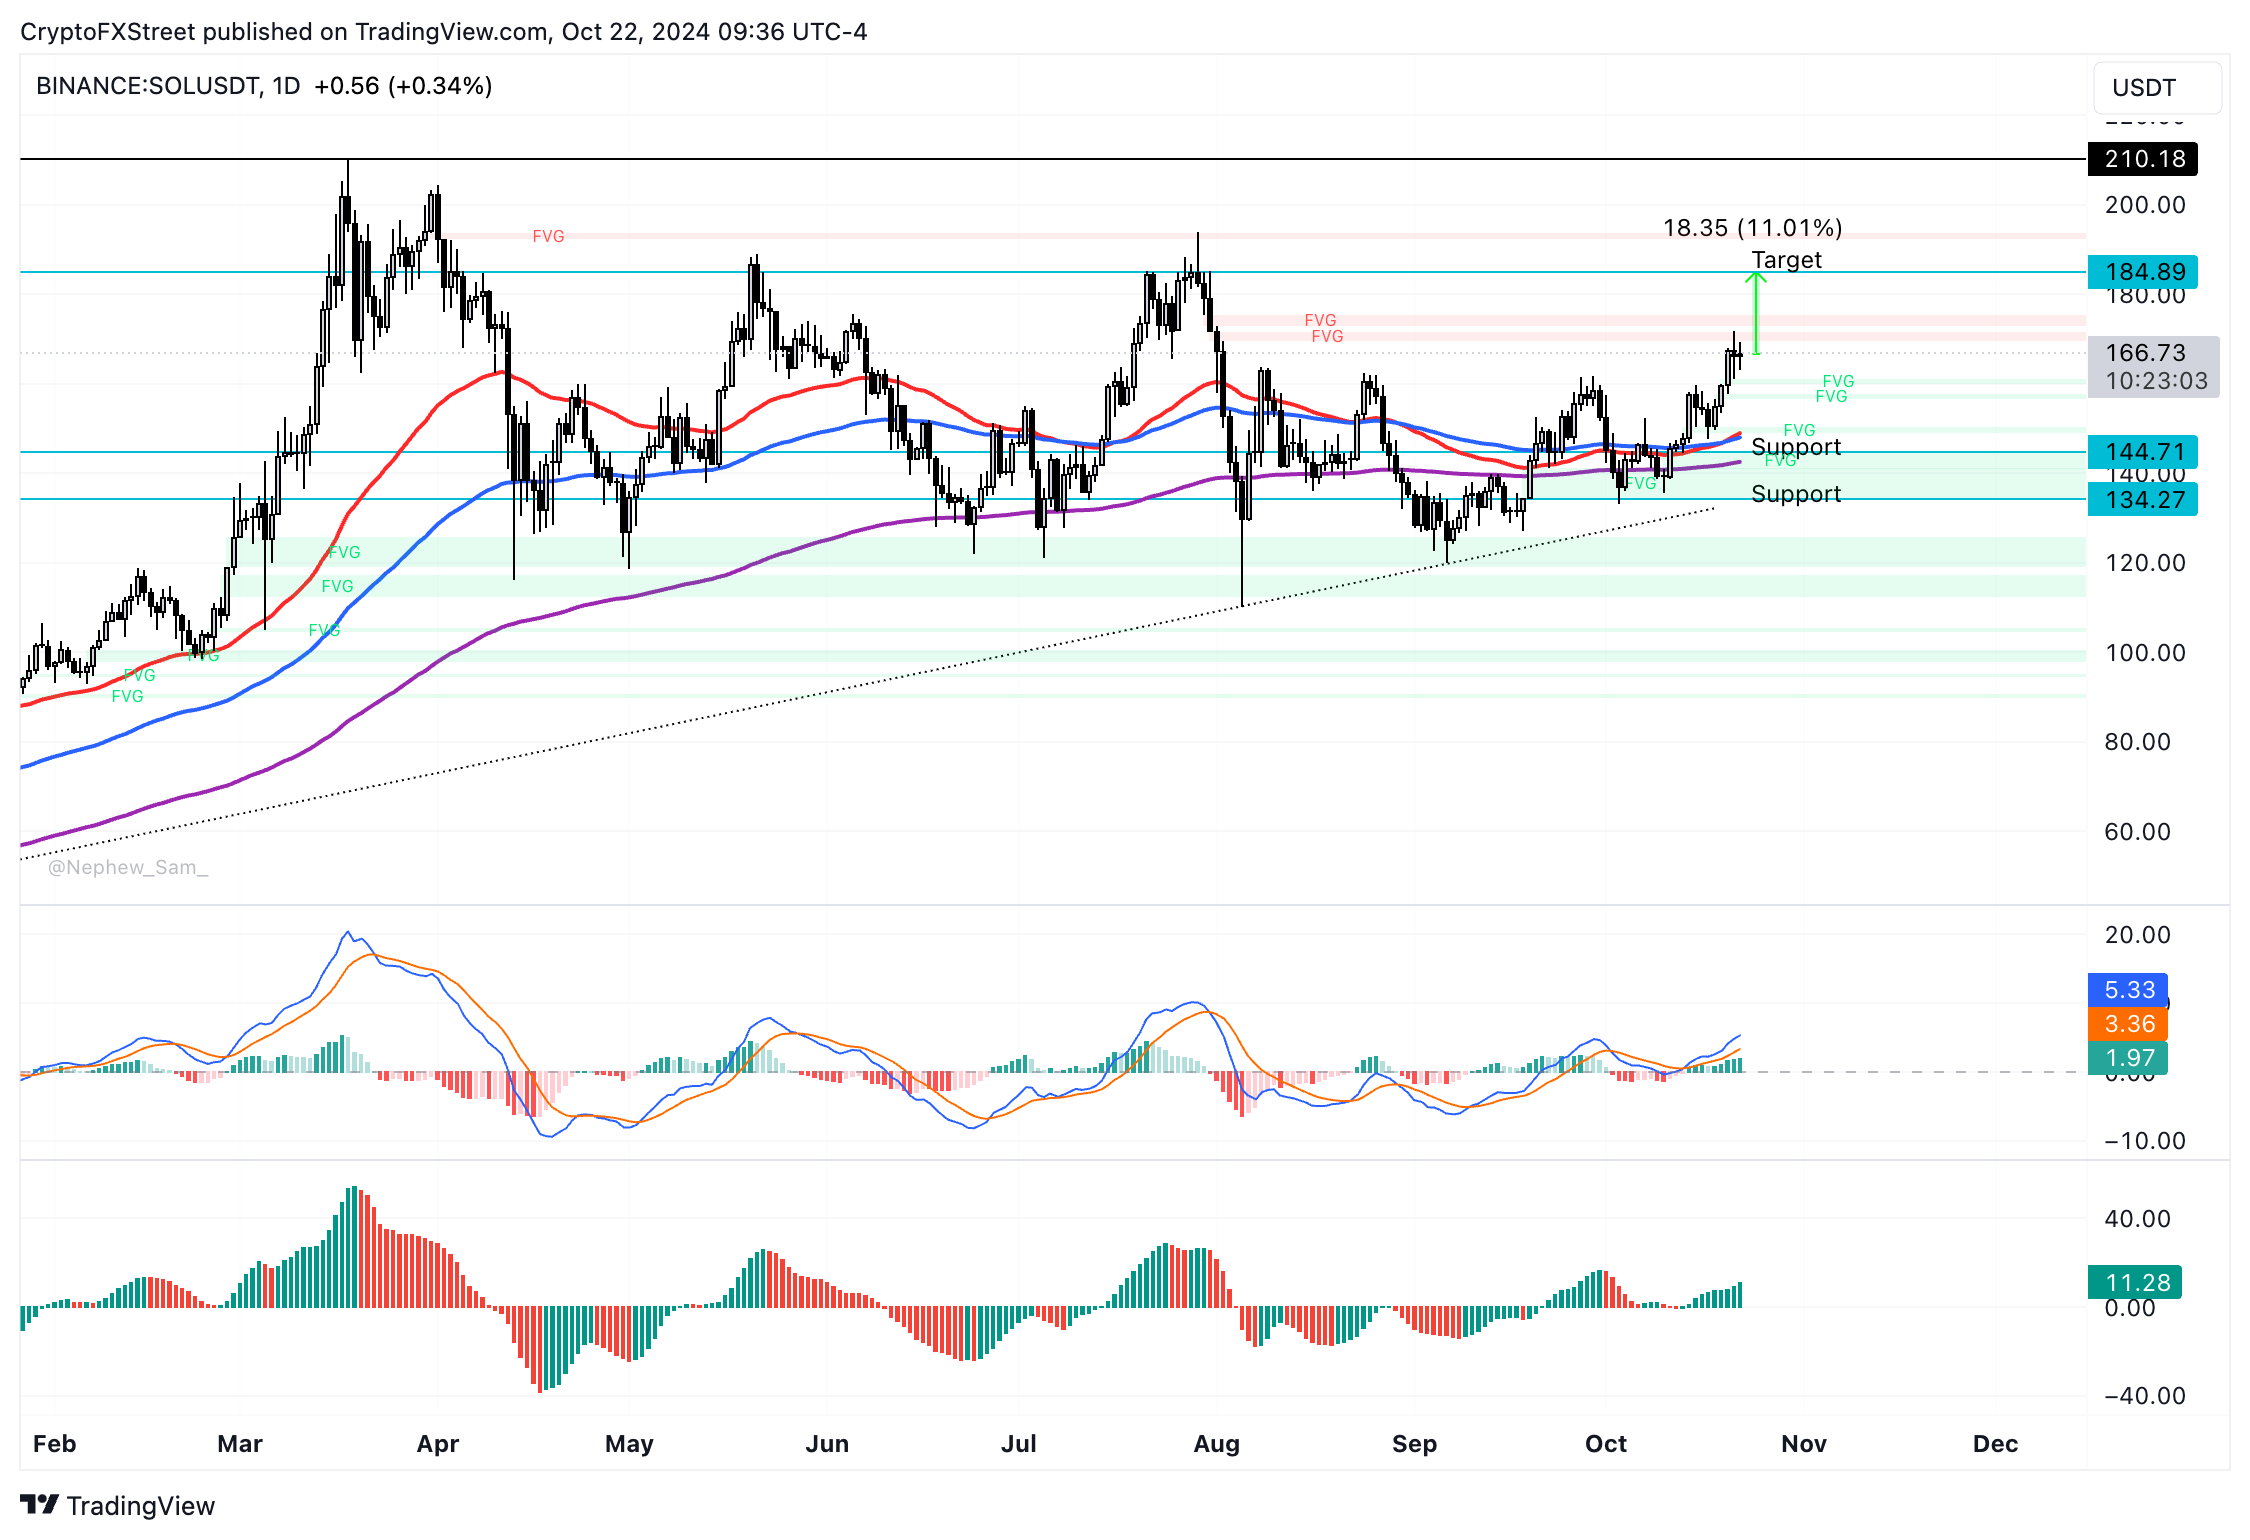
SOL/USDT daily chart
On the other side, Solana could find support at the 50-day Exponential Moving Average at $147.90 and the October 12 low at $144.71, which coincides with the upper boundary of a Fair Value Gap (FVG) on the daily chart.
A daily candlestick close below Monday’s low of $160.99 could invalidate the bullish thesis.
Author

Ekta Mourya
FXStreet
Ekta Mourya has extensive experience in fundamental and on-chain analysis, particularly focused on impact of macroeconomics and central bank policies on cryptocurrencies.


