Solana Price Forecast: Bulls raise $200M leverage after three-day losing streak
- Solana (SOL) price rebounded by a mild 3% on Wednesday, halting a three-day losing streak.
- Aggregate long leverage SOL futures positions hit $212 million at press time, surpassing the active short contracts by more than 50%.
- Technical indicators show that SOL is still within oversold territories, signaling further upside potential.

Solana price rebounded by a mild 3% on Wednesday, halting a 3-day losing streak, as markets reacted positively to the latest US Fed rate pause decision. Derivatives markets trends show aggressive leverage activity among bulls traders, signaling growing conviction on further SOL upside.
Solana price retakes $230 as Crypto markets digest US Fed decision
Solana (SOL) rebounded on Wednesday, climbing 2.7% intraday to retake the $230 price level as broader crypto markets reacted positively to the U.S. Federal Reserve’s rate pause decision.
The mild recovery comes after a challenging start to the week, where SOL suffered three consecutive losing sessions, declining by 11.4% amid macroeconomic uncertainty.
The Fed’s decision to maintain interest rates at current levels provided a relief rally across risk assets, including cryptocurrencies. Bitcoin (BTC) led the charge, surging as the Czech central bank announced plans to buy BTC as part of its reserve strategy.
Likewise, Chainlink (LINK) benefited from bullish sentiment tied to Trump’s deepening crypto involvement.
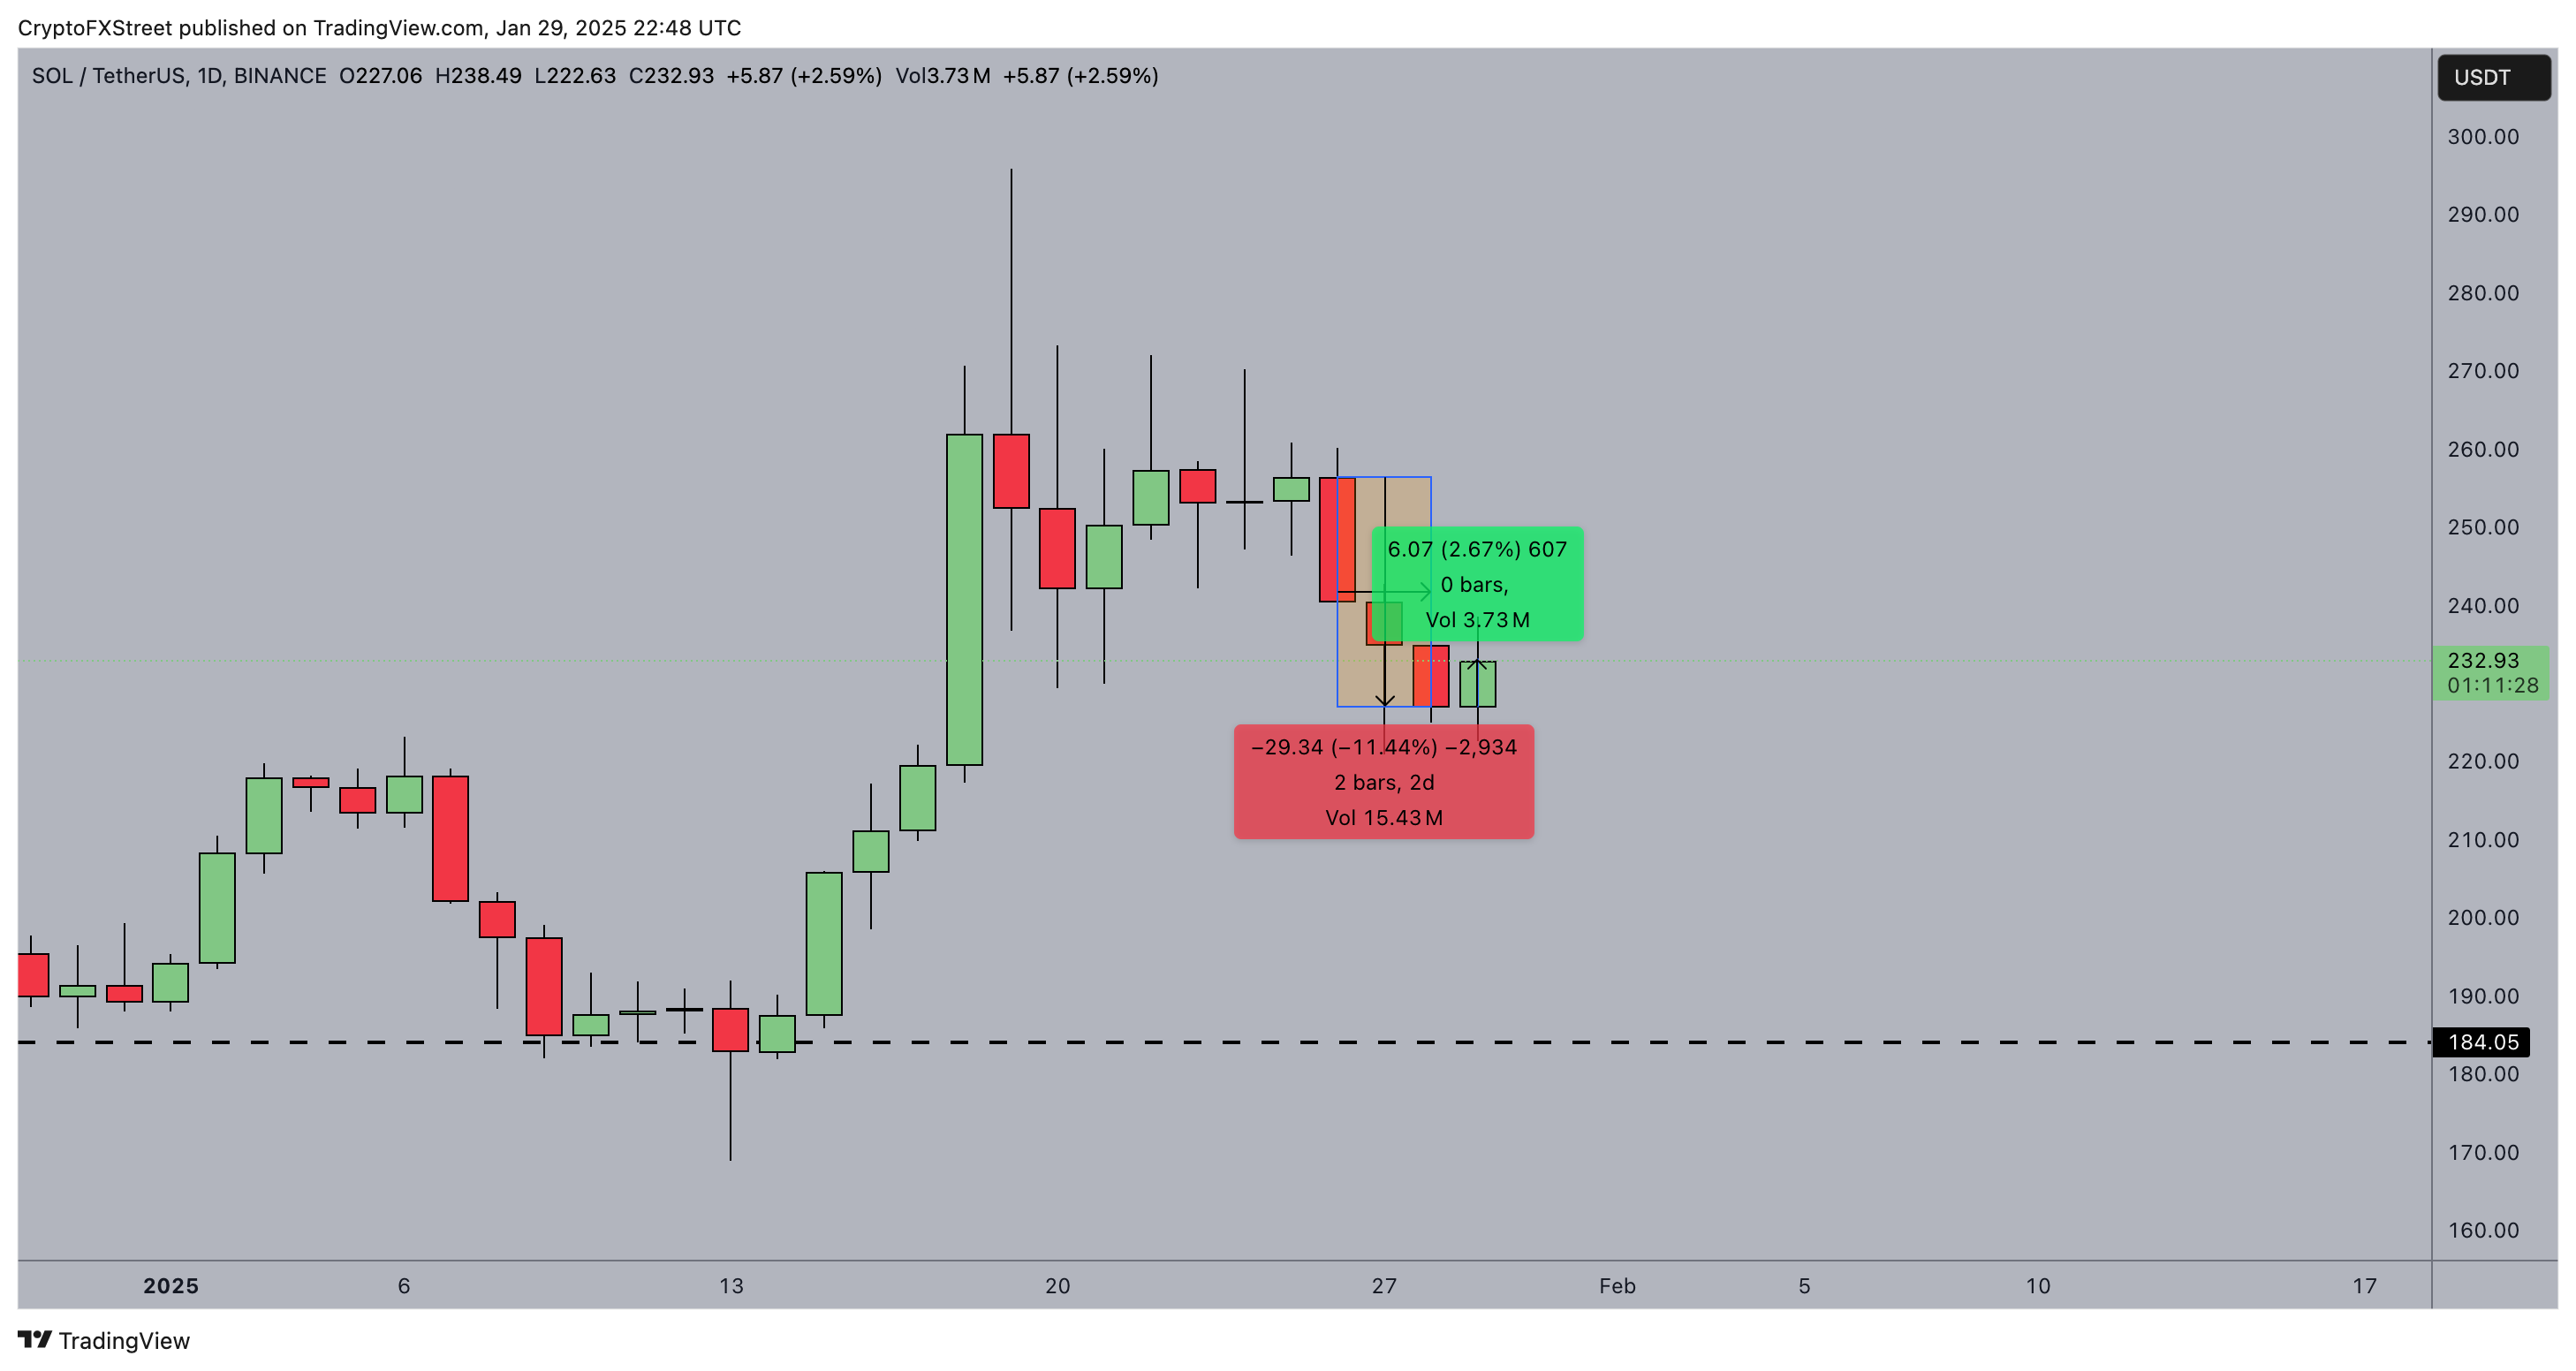
Against the backdrop of the positive outlook from the Fed decision, SOL traders also seized the opportunity to buy the dip.
According to TradingView data, SOL opened the day at $227, briefly surging to $238 before stabilizing around $232 at press time.
This 2.7% recovery marks a potential turning point for Solana’s price trajectory after its 11.4% three-day slump, signaling renewed investor confidence.
Solana bulls target more gains with $200M leverage
Solana’s recovery above $230 following a three-day losing streak suggests a potential local bottom formation, setting the stage for a broader rebound.
Derivatives market trends further support this bullish outlook, as traders increase leveraged long positions, betting on extended upside.
Data from Coinglass’s liquidation map reveals critical insights into Solana’s near-term price trajectory.
The liquidation map tracks clusters of leveraged positions across different price levels, which often dictate price movements as market makers hunt for liquidity to trigger liquidations.
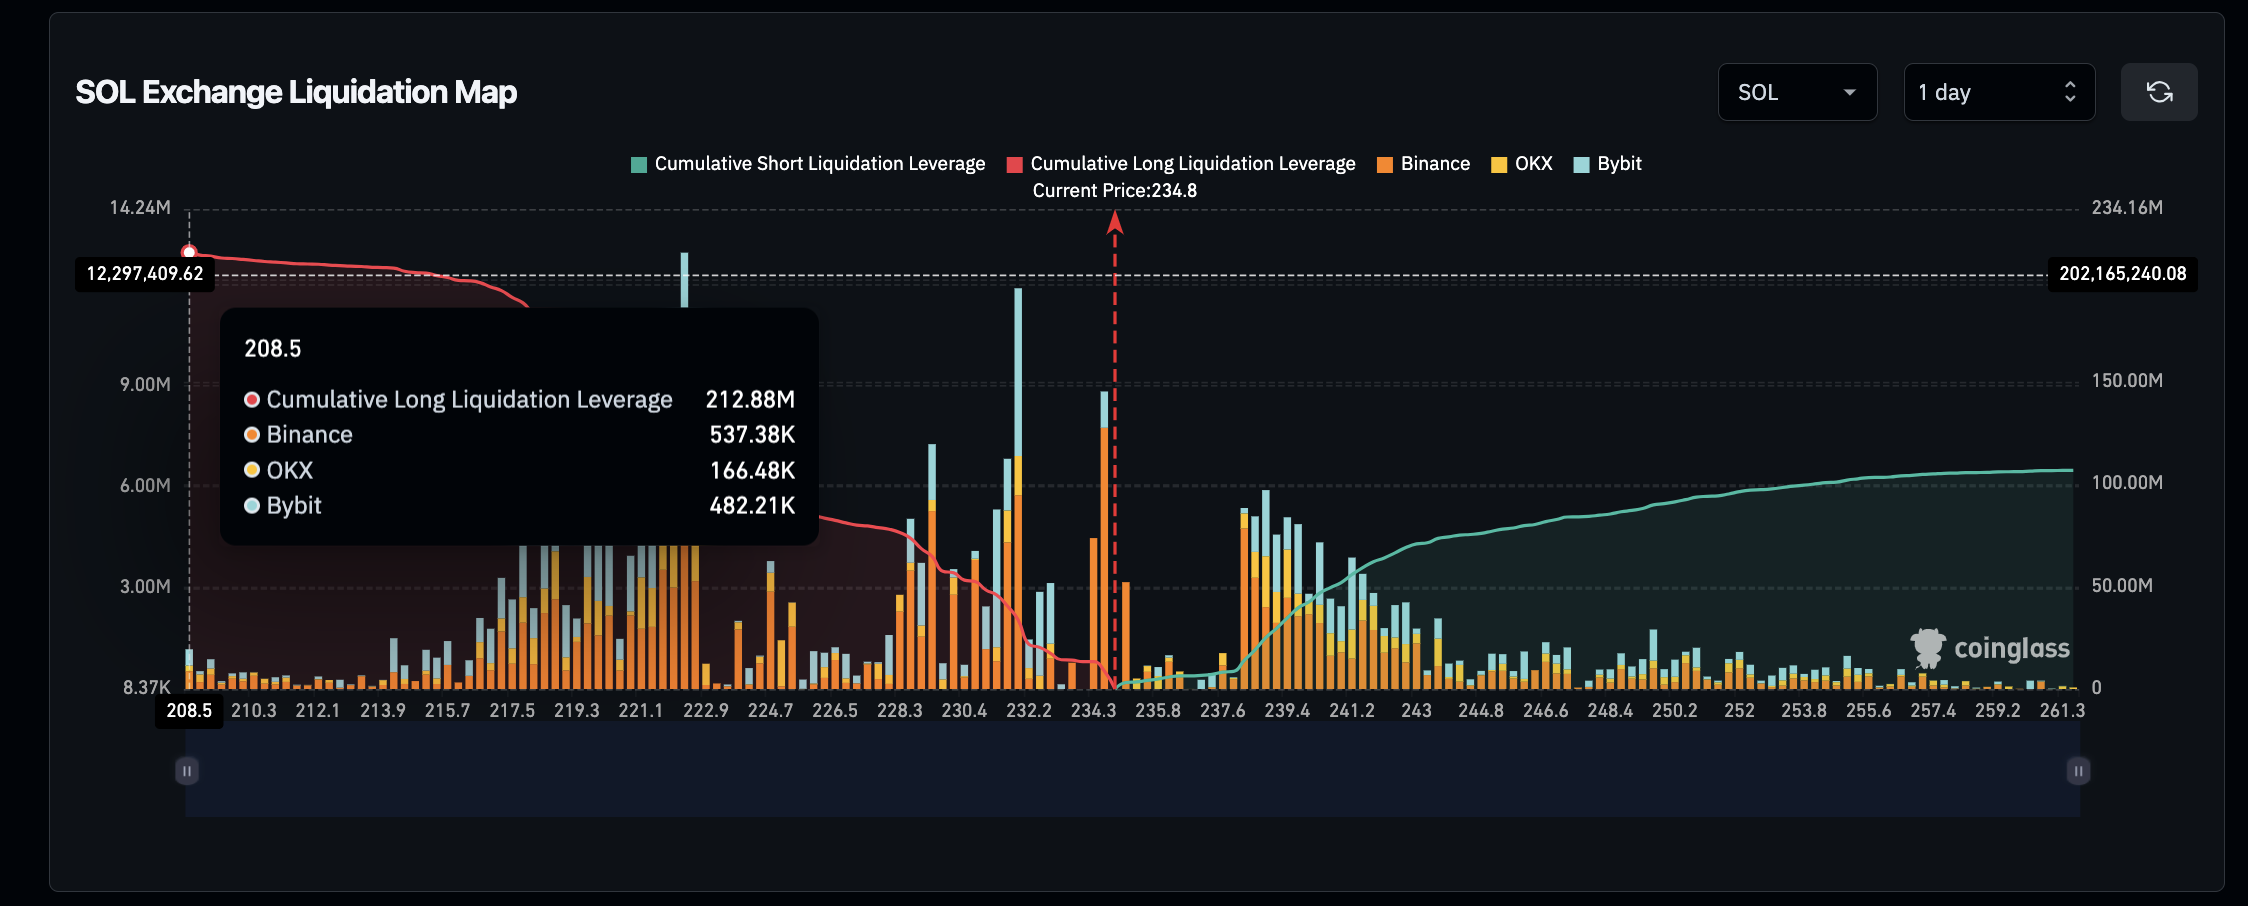
Solana Liquidation Map, January 2025 | Source: Coinglass
According to the Coinglass data, long positions on Solana surged past $212 million on Wednesday, significantly outpacing short contracts, which stood at just $106 million.
This stark imbalance suggests that bullish traders are aggressively entering positions after Solana’s latest rebound.
A closer arithmetic breakdown of this data highlights that SOL long positions account for approximately 66.7% of total leverage, signaling a clear bullish bias within the Solana derivatives market.
This bullish positioning is significant because when long leverage overtakes short positions after a period of prolonged losses—like Solana’s 11.4% three-day drop—it often signals the formation of a local bottom. With demand surging, market makers could drive SOL’s price higher to force liquidations on short sellers, further fueling upside momentum.
SOL Price Forecast: $250 rebound in focus
When an asset LONG leverage exceeds SHORTs after a period of prolonged losses as observed in Solana markets this week, it often signals a local bottom formation.
Hence, Solana price appears poised for an extended rebound towards the $250 level.
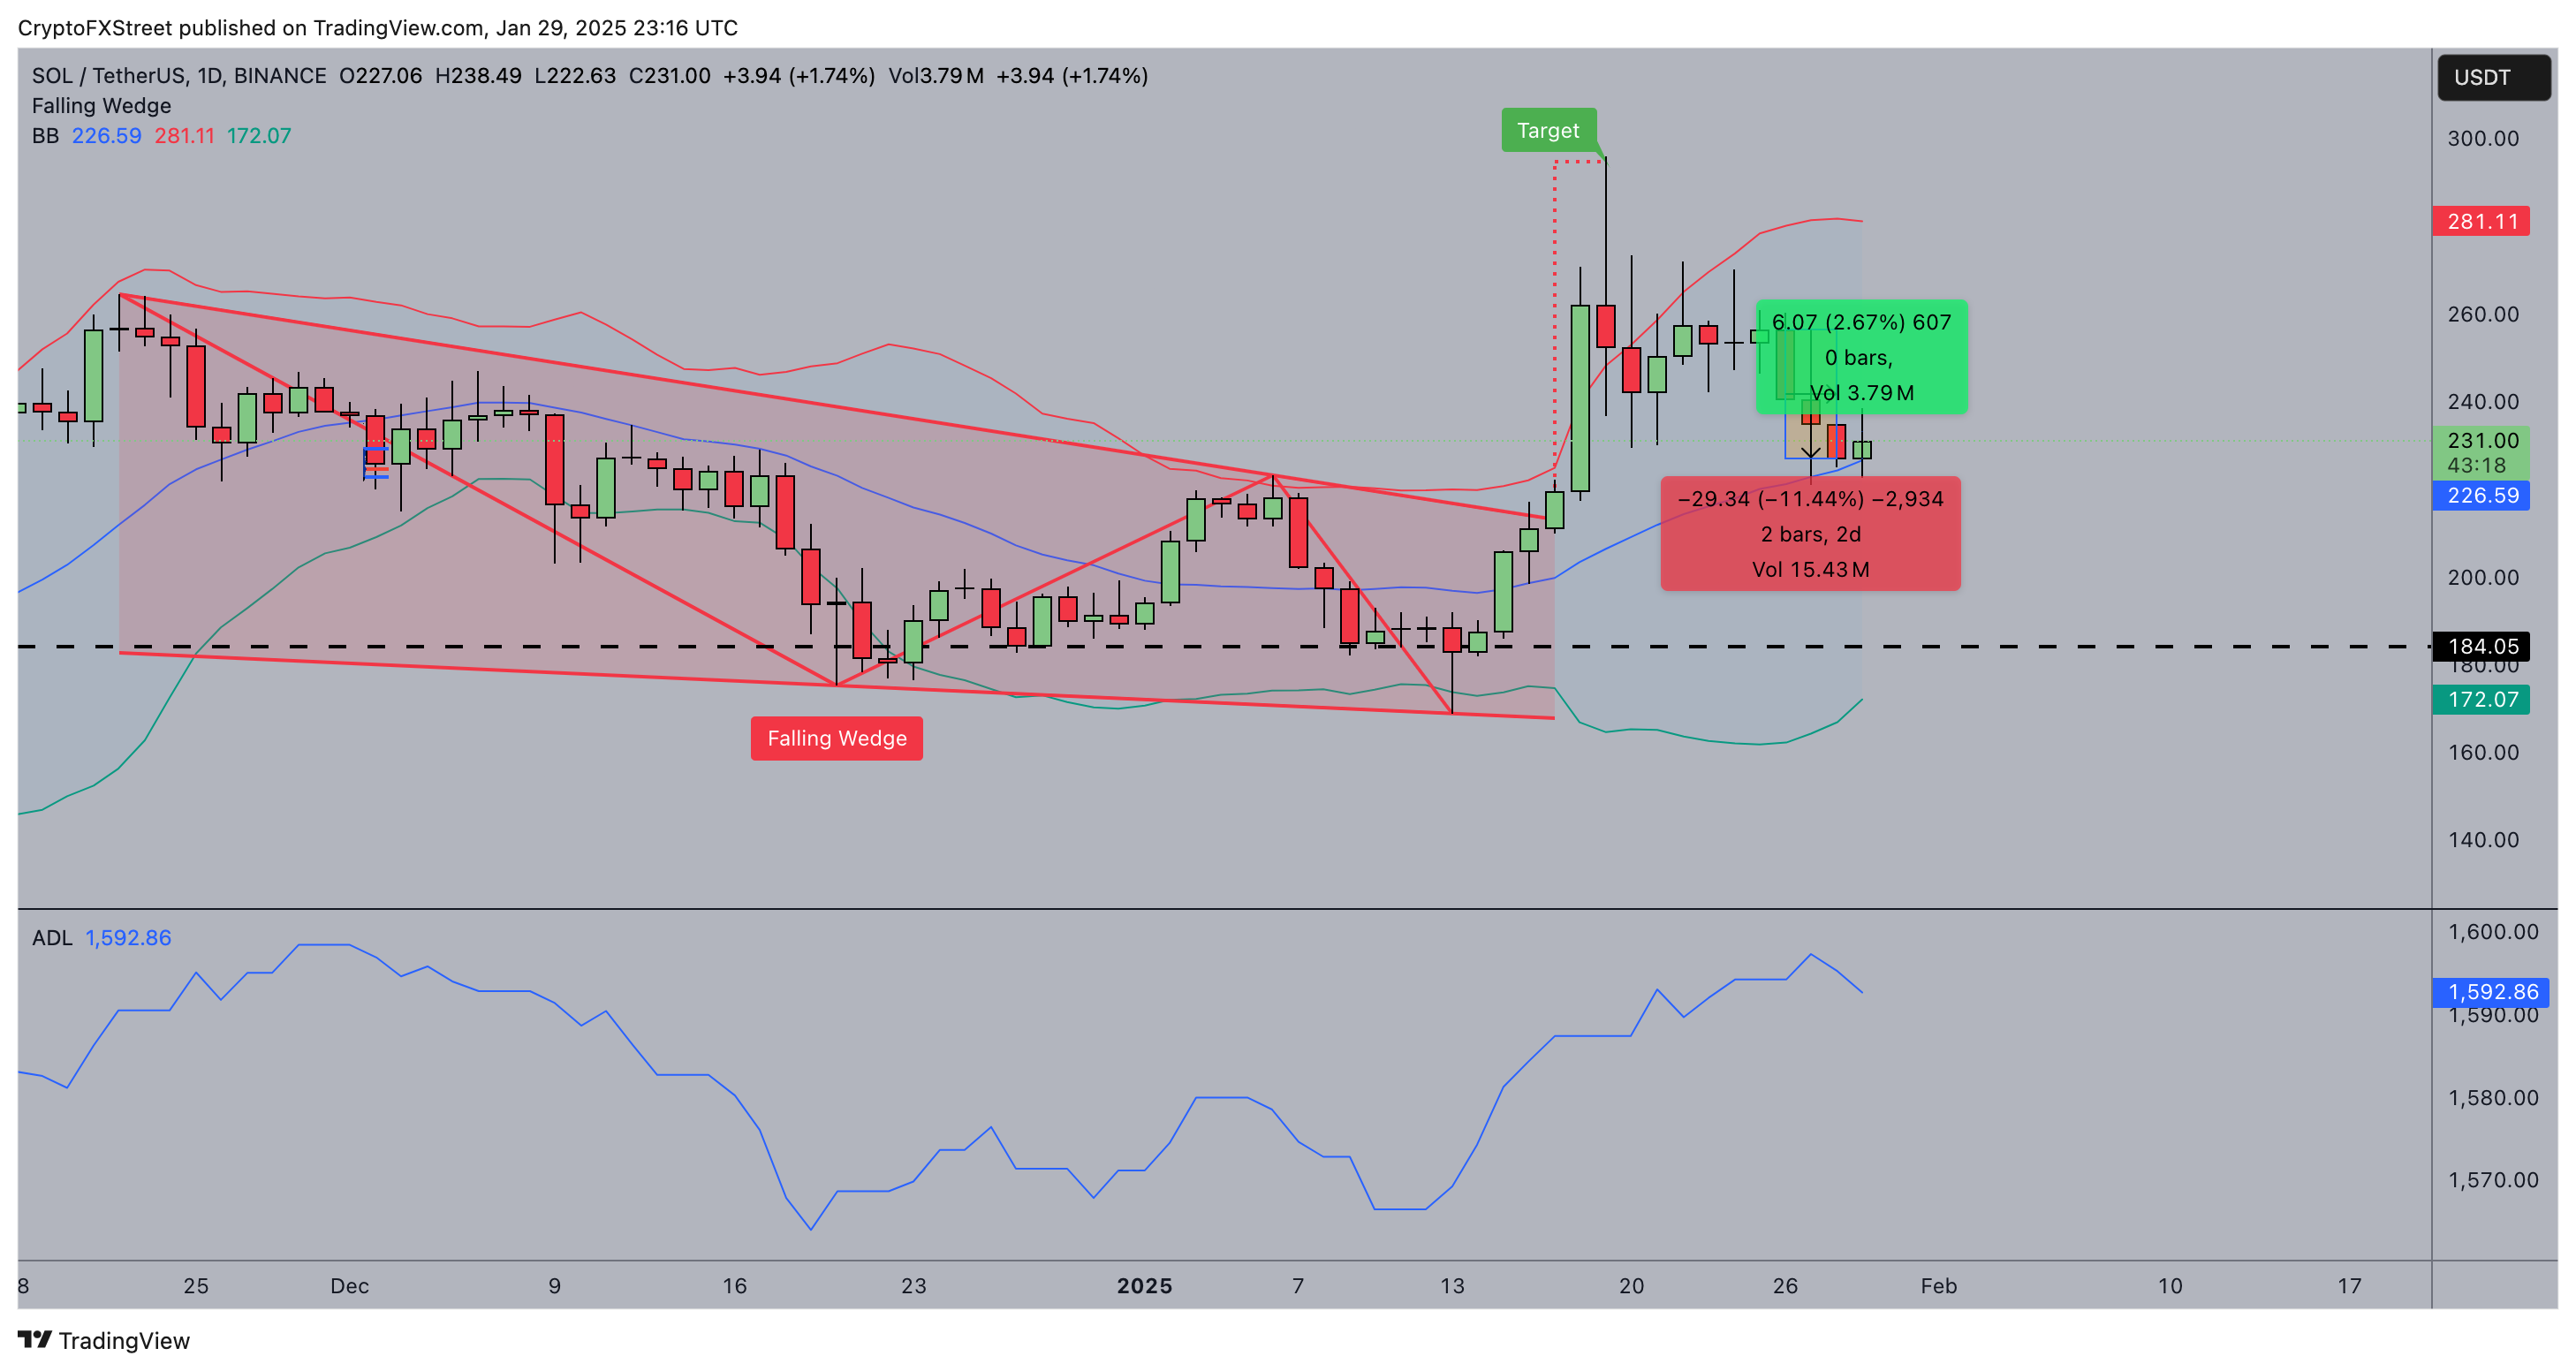
Solana’s price action is showing signs of a potential local bottom after a sharp 11.44% decline over two days, where price dipped to $222.63 before bouncing to $231.08.
The falling wedge breakout remains intact, reinforcing the broader uptrend despite the temporary correction.
The Bollinger Bands suggest price is testing support near $226.60, the middle band, which often acts as a re-entry point for bulls.
The Accumulation/Distribution Line (ADL) at 1,592.87 reflects strong buying interest despite recent selling pressure, indicating that demand remains resilient.
Solana (SOL) Price Forecast
A successful hold above the $226 level would support a continuation toward $250, with $281.12—the upper Bollinger Band—as the next key resistance.
Conversely, a failure to sustain above $222 could trigger further downside toward $184, the next major support level.
The volume spike during the selloff suggests capitulation, a condition often preceding a reversal.
With momentum shifting, Solana appears poised for a bullish rebound unless $222 support collapses.
Author

Ibrahim Ajibade
FXStreet
Ibrahim Ajibade is an accomplished Crypto markets Reporter who began his career in commercial banking. He holds a BSc, Economics, from University of Ibadan.



