Shiba Inu Layer 2 chain records highest number of projects in three months, SHIB poised for gains
- Shiba Inu Layer 2 Shibarium records a three-month high in the number of contracts deployed on its chain.
- Shibarium is an Ethereum scaling solution that noted a surge in developer activity on the Shiba Inu network.
- SHIB could extend gains by nearly 14%, target August 26 high of $0.00001525.

Shiba Inu (SHIB) ecosystem’s Layer 2 chain hit an important milestone as it recorded the highest number of contracts deployed in three months. A Shiba Inu team member behind the X handle @LucieSHIB shared Shibarium’s milestone in a recent tweet.
SHIB’s on-chain metrics support a bullish thesis for the meme coin.
Shibarium reaches three-month high in contracts deployed on the chain
Shibarium, an Ethereum scaling solution in the Shiba Inu ecosystem, reached a three-month high in the number of contracts deployed on the platform. Less than two weeks ago, Shiba Inu rolled out a developer toolkit to invite projects to build on Shibarium. Data from Shibariumscan shows that 34 contracts were deployed on September 5, which is slightly lower than July’s 36.
The number of contracts deployed is indicative of the projects rolled out on Shibarium, signaling rising confidence from developers and users.
-638615772576656455.png)
Shibarium new contracts deployed
The Shiba Inu marketing executive tweeted about the development:
Shibarium and Shiba Eternity Update
— (@LucieSHIB) September 9, 2024
Shibarium approached a 3-month high in deployed contracts, showing strong developer activity.
Shiba Eternity Build Update Highlights:
•Tournaments: New leaderboards and rewards system.
•Bug Fixes: Issues with freezing, loading screens,… pic.twitter.com/ekQg7gELrk
Shiba Inu on-chain metrics turn bullish
Shiba Inu on-chain metrics show signs of gains in the meme coin. Market Value to Realized Value (MVRV) on a 30-day time frame is -2.067%. This metric checks whether an asset is undervalued or overvalued in a given time frame. MVRV for Shiba Inu shows that the meme coin is undervalued.
 [18.28.24, 10 Sep, 2024]-638615773124954871.png)
Shiba Inu MVRV (30-day)
SHIB traders have consistently realized losses in the last 30 days. The Network Realized Profit/Loss metric, which measures the net profit/loss of all assets sold on a given day, shows consistent negative spikes since July 2024. The negative spikes represent losses realized by SHIB holders, and typically consistent loss realization is followed by capitulation.
Capitulation refers to a situation where market participants lose hope and liquidate their long positions in an asset, realizing large volume losses. This is followed by a recovery in the asset’s price.
 [18.28.18, 10 Sep, 2024]-638615773950317739.png)
Shiba Inu NPL
SHIB eyes 14% gains
Shiba Inu has been in a multi-month downward trend that started in March 2024. Since then, SHIB price declined to the August 5 low of $0.00001078 before recovering to $0.00001336 at the time of writing.
The dog-themed meme coin is likely to extend its gains, and momentum indicators support the bullish thesis. Moving Average Convergence Divergence (MACD) shows green histogram bars above the neutral line, signaling a positive underlying momentum in SHIB price trend.
The Relative Strength Index (RSI) reads 45 at the time of writing, just below the neutral level at 50.
Shiba Inu could extend gains by 13.5% and rally to its target of $0.00001525, a key level for the meme coin, and the August 26 high.
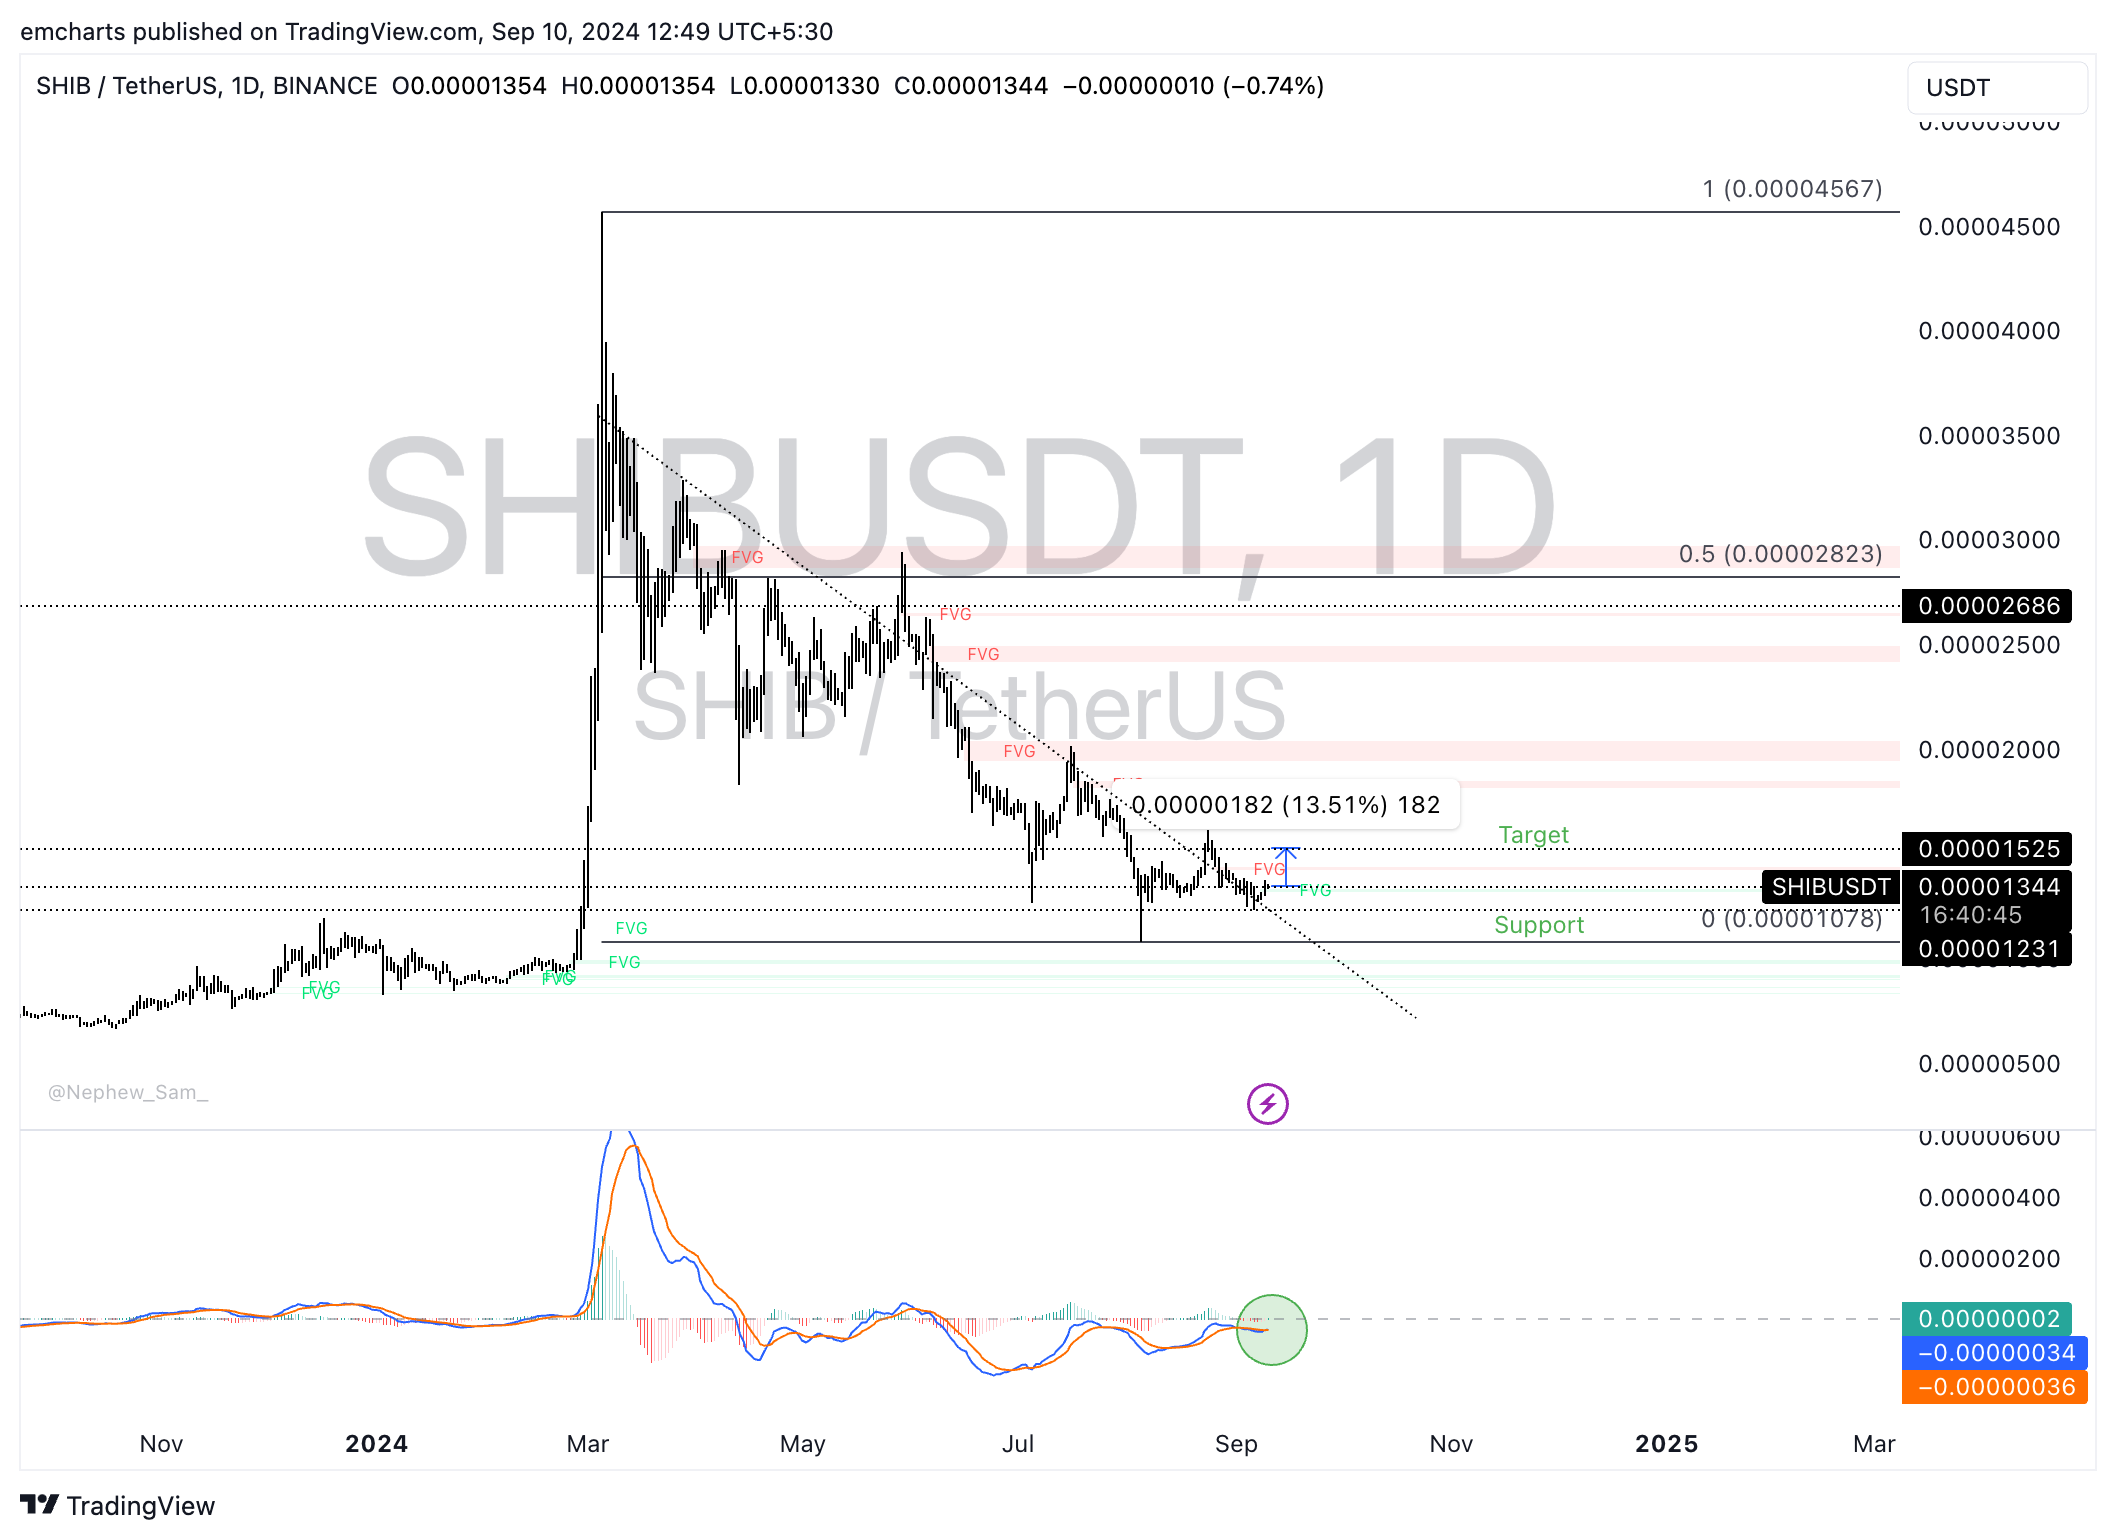
SHIB/USDT daily chart
In the event of a correction, Shiba Inu could find support at the August 5 low of $0.00001078.
Cryptocurrency metrics FAQs
The developer or creator of each cryptocurrency decides on the total number of tokens that can be minted or issued. Only a certain number of these assets can be minted by mining, staking or other mechanisms. This is defined by the algorithm of the underlying blockchain technology. Since its inception, a total of 19,445,656 BTCs have been mined, which is the circulating supply of Bitcoin. On the other hand, circulating supply can also be decreased via actions such as burning tokens, or mistakenly sending assets to addresses of other incompatible blockchains.
Market capitalization is the result of multiplying the circulating supply of a certain asset by the asset’s current market value. For Bitcoin, the market capitalization at the beginning of August 2023 is above $570 billion, which is the result of the more than 19 million BTC in circulation multiplied by the Bitcoin price around $29,600.
Trading volume refers to the total number of tokens for a specific asset that has been transacted or exchanged between buyers and sellers within set trading hours, for example, 24 hours. It is used to gauge market sentiment, this metric combines all volumes on centralized exchanges and decentralized exchanges. Increasing trading volume often denotes the demand for a certain asset as more people are buying and selling the cryptocurrency.
Funding rates are a concept designed to encourage traders to take positions and ensure perpetual contract prices match spot markets. It defines a mechanism by exchanges to ensure that future prices and index prices periodic payments regularly converge. When the funding rate is positive, the price of the perpetual contract is higher than the mark price. This means traders who are bullish and have opened long positions pay traders who are in short positions. On the other hand, a negative funding rate means perpetual prices are below the mark price, and hence traders with short positions pay traders who have opened long positions.
Author

Ekta Mourya
FXStreet
Ekta Mourya has extensive experience in fundamental and on-chain analysis, particularly focused on impact of macroeconomics and central bank policies on cryptocurrencies.


