Sandbox needs to close above this level before SAND can hit new all-time highs
- Sandbox price crushing short-sellers with a rally in excess of 10%.
- Critical support found within the Ichimoku system hints at a sustained rally.
- Near-term resistance could limit further upside potential.

Sandbox price has been on a clear and powerful drive higher during the Wednesday trading session. Fears of a much deeper sell-off have been mostly abated as SAND looks towards upcoming resistance before it can pursue new all-time highs.
Sandbox price must break and close above $5.80 to generate another bull run
Sandbox price displayed a clear rejection of any further, near-term bearish momentum after establishing support against the bottom of the Cloud (Senkou Span B) at $4.62. Adding to the bullish bounce is the current move above the Tenkan-Sen and the mid-line of the Linear Regression Band (blue diagonal channel lines). The Linear Regression Band is also the current bull flag.
There is some powerful resistance up ahead for Sandbox price between $5.60 and $5.80. The top of the Ichimoku Cloud and the Kijun-Sen share the $5.60 level, while the upper line of the Linear Regression Band is at $5.80. As a result, SAND will likely face some selling pressure against one or both of those resistance levels, falling back inside the Cloud and then testing the Tenkan-Sen as support.
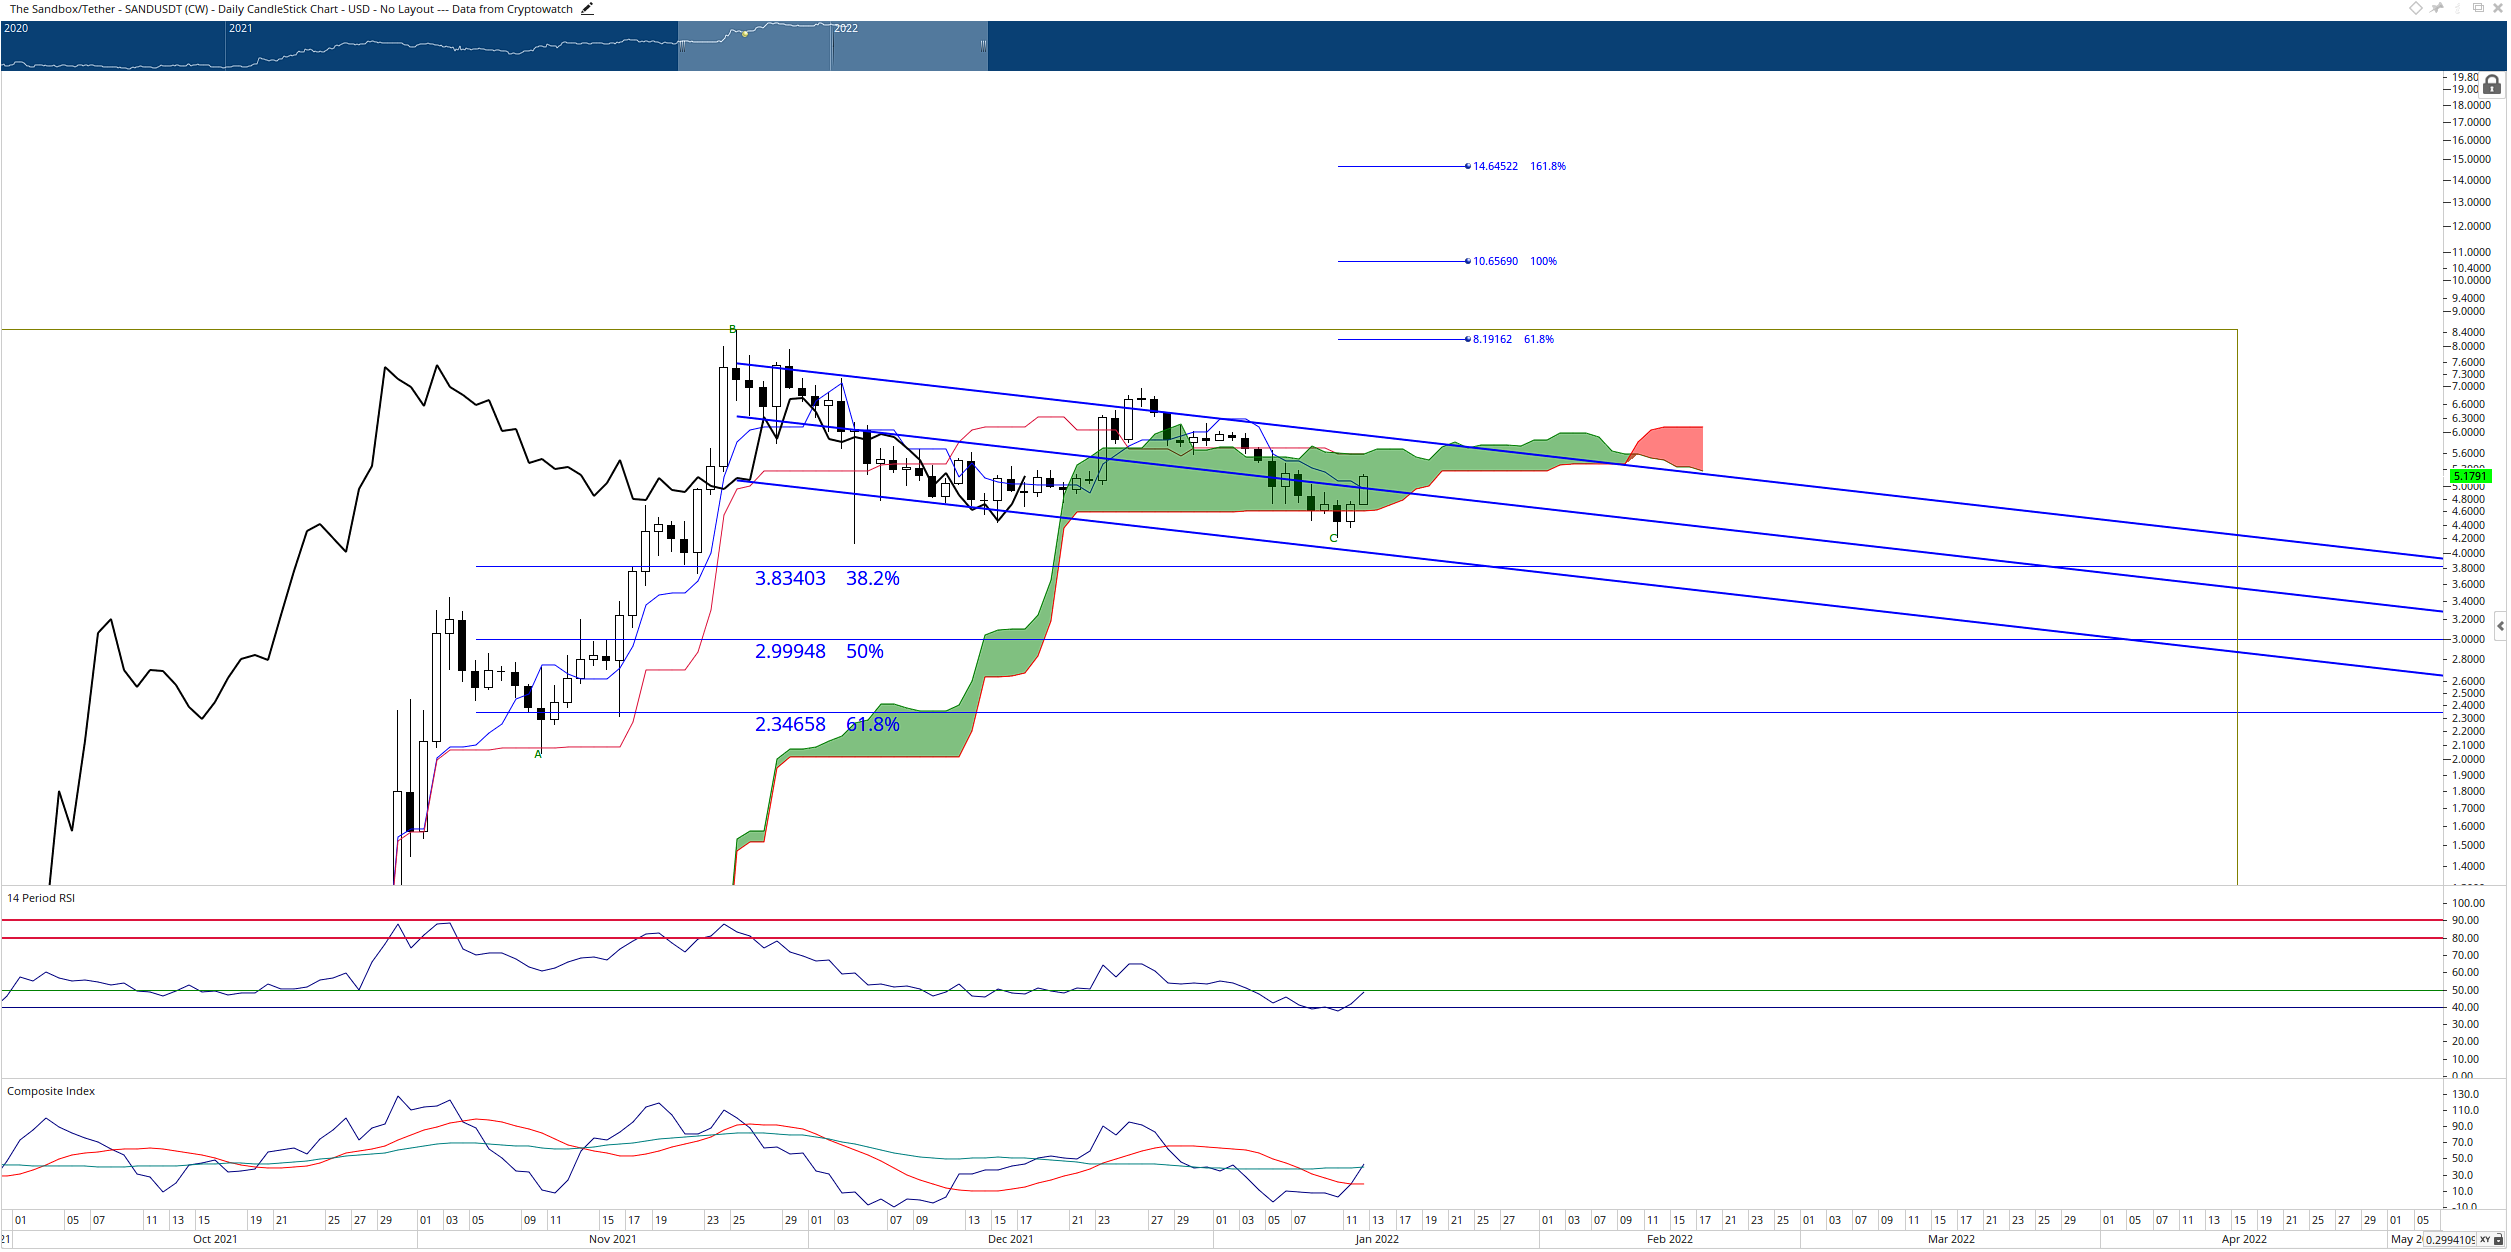
SAND/USDT Daily Ichimoku Chart
However, a clear breakout with a daily close above $5.80 would fulfill all the conditions needed for an Ideal Bullish Ichimoku Breakout entry – the most critical condition being the Chikou Span in open space. If Sandbox price achieves a close above $5.80, it should have a wide-open road to test new all-time highs near the 100% Fibonacci expansion at $10.66 and the 161.8% Fibonacci expansion at $14.65.
Author

Jonathan Morgan
Independent Analyst
Jonathan has been working as an Independent future, forex, and cryptocurrency trader and analyst for 8 years. He also has been writing for the past 5 years.


