Sandbox price to rebound strongly as SAND bulls prepare for 30% upswing
- Sandbox price could be awaiting a sharp reversal as a technical indicator suggests that a local bottom has been formed.
- The token could tag the upper boundary of the governing chart pattern at $5.90 next.
- If SAND slices above $5.90, an additional 51% upswing will be on the radar.

Sandbox price may have set a local bottom on January 10 as a key technical indicator suggests that SAND is ready for a bullish reversal. Although there may be multiple obstacles ahead, the token could tag the upper boundary of the governing chart pattern at $5.90, resulting in a 30% ascent.
Sandbox price flashes bottom signal
Sandbox price has formed a symmetrical triangle pattern on the daily chart. The token has recently tagged and found reliable support at the lower boundary of the governing technical pattern.
The Momentum Reversal Indicator (MRI) also flashed a bottom signal on the January 11 candle, suggesting that a rebound may be in the offing. Sandbox price will face its first hurdle at the 23.6% Fibonacci retracement level at $4.85, then at the 38.2% Fibonacci retracement level at $5.25.
Additional resistance may emerge at $5.57, where the 50% retracement level and 21-day Simple Moving Average (SMA) intersect. Sandbox price may also face a headwind at the 50-day SMA at $5.69.
Only if Sandbox price manages to slice above the aforementioned obstacles would see the token tag the upper boundary of the governing technical pattern at $5.90, coinciding with the 61.8% Fibonacci retracement level and the resistance line given by the MRI.
If a spike in buy orders occurs, pushing Sandbox price above the upper boundary of the triangle and breaking above the 78.6% Fibonacci retracement level at $6.36, an additional 51% climb toward $9.03 could be on the radar, derived from the upside target of the governing technical pattern.
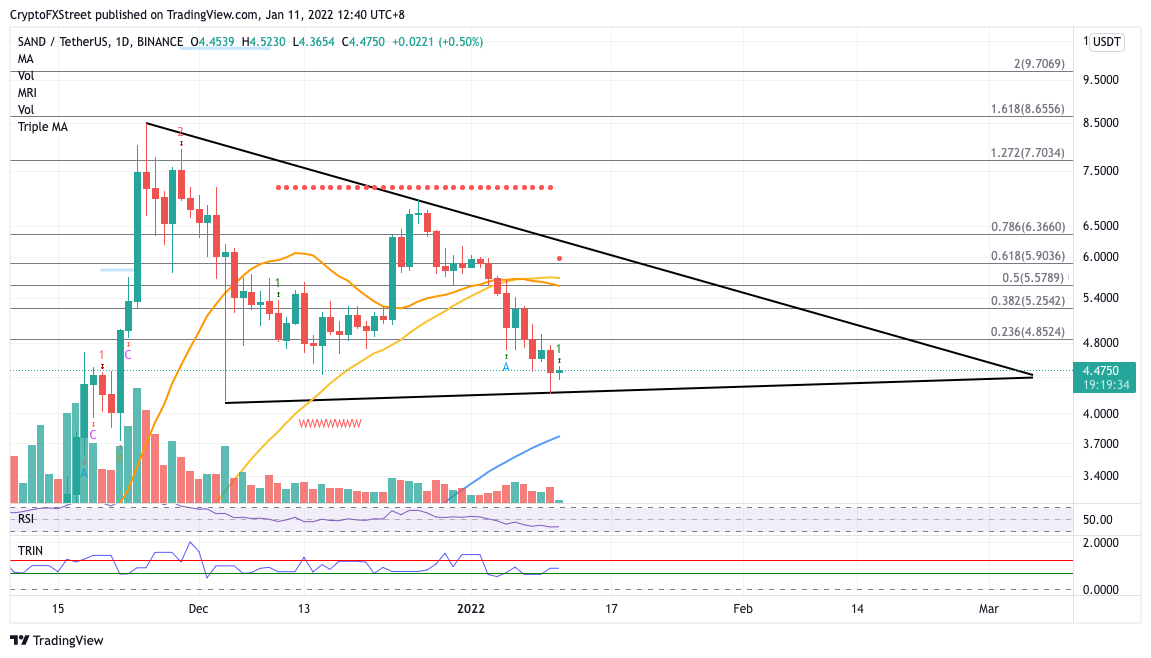
SAND/USDT daily chart
If selling pressure increases, Sandbox price could slide lower to tag the lower boundary of the triangle at $4.24 as immediate support. However, if SAND drops below this line of defense, the token could collapse further toward $3.78, at the 100-day SMA and the November 22 low.
Author

Sarah Tran
Independent Analyst
Sarah has closely followed the growth of blockchain technology and its adoption since 2016.


