|

Sandbox continues to drift lower, bears to push SAND to $3.80

  • Sandbox price down 14% from Monday.
  • Buyers are entering and buying SAND near two-month lows.
  • Downside pressure remains strong and the most likely direction.

Sandbox price has made a slight bounce during the Thursday trading session, attempting a bullish daily close after three straight days of losses. However, sellers remain in control, and bulls will need to make some significant gains to convert SAND back into a bull market.

Sandbox price recovers slightly but remains at risk for a more profound drop

Sandbox price is in a clear downtrend within the Ichimoku Kinko Hyo system. Furthermore, no daily support exists within the Ichimoku system, signaling a wide-open range to continue moving lower. However, downside risks should be limited to a confluence zone of support near $3.80, where the bottom of the bull flag and the 38.2% Fibonacci retracement sit.

The current $0.10/3-box reversal Point and Figure chart presents a long trade opportunity based on a Pole Pattern. Pole Pattern entries require at least five boxes below the multiple top/bottom, but no more than fifteen boxes. The entry on a Pole Pattern is at the 50% retracement of the pattern. For Sandbox price, the 50% retracement is at $4.60.

The theoretical long trade is a buy stop order at $4.60, a stop loss at $4.20, and a profit target at $6.20. The trade represents a 4:1 reward/risk setup with an implied profit target of 36% from the entry. A two-box trailing stop would help protect any implied profit made after the entry.

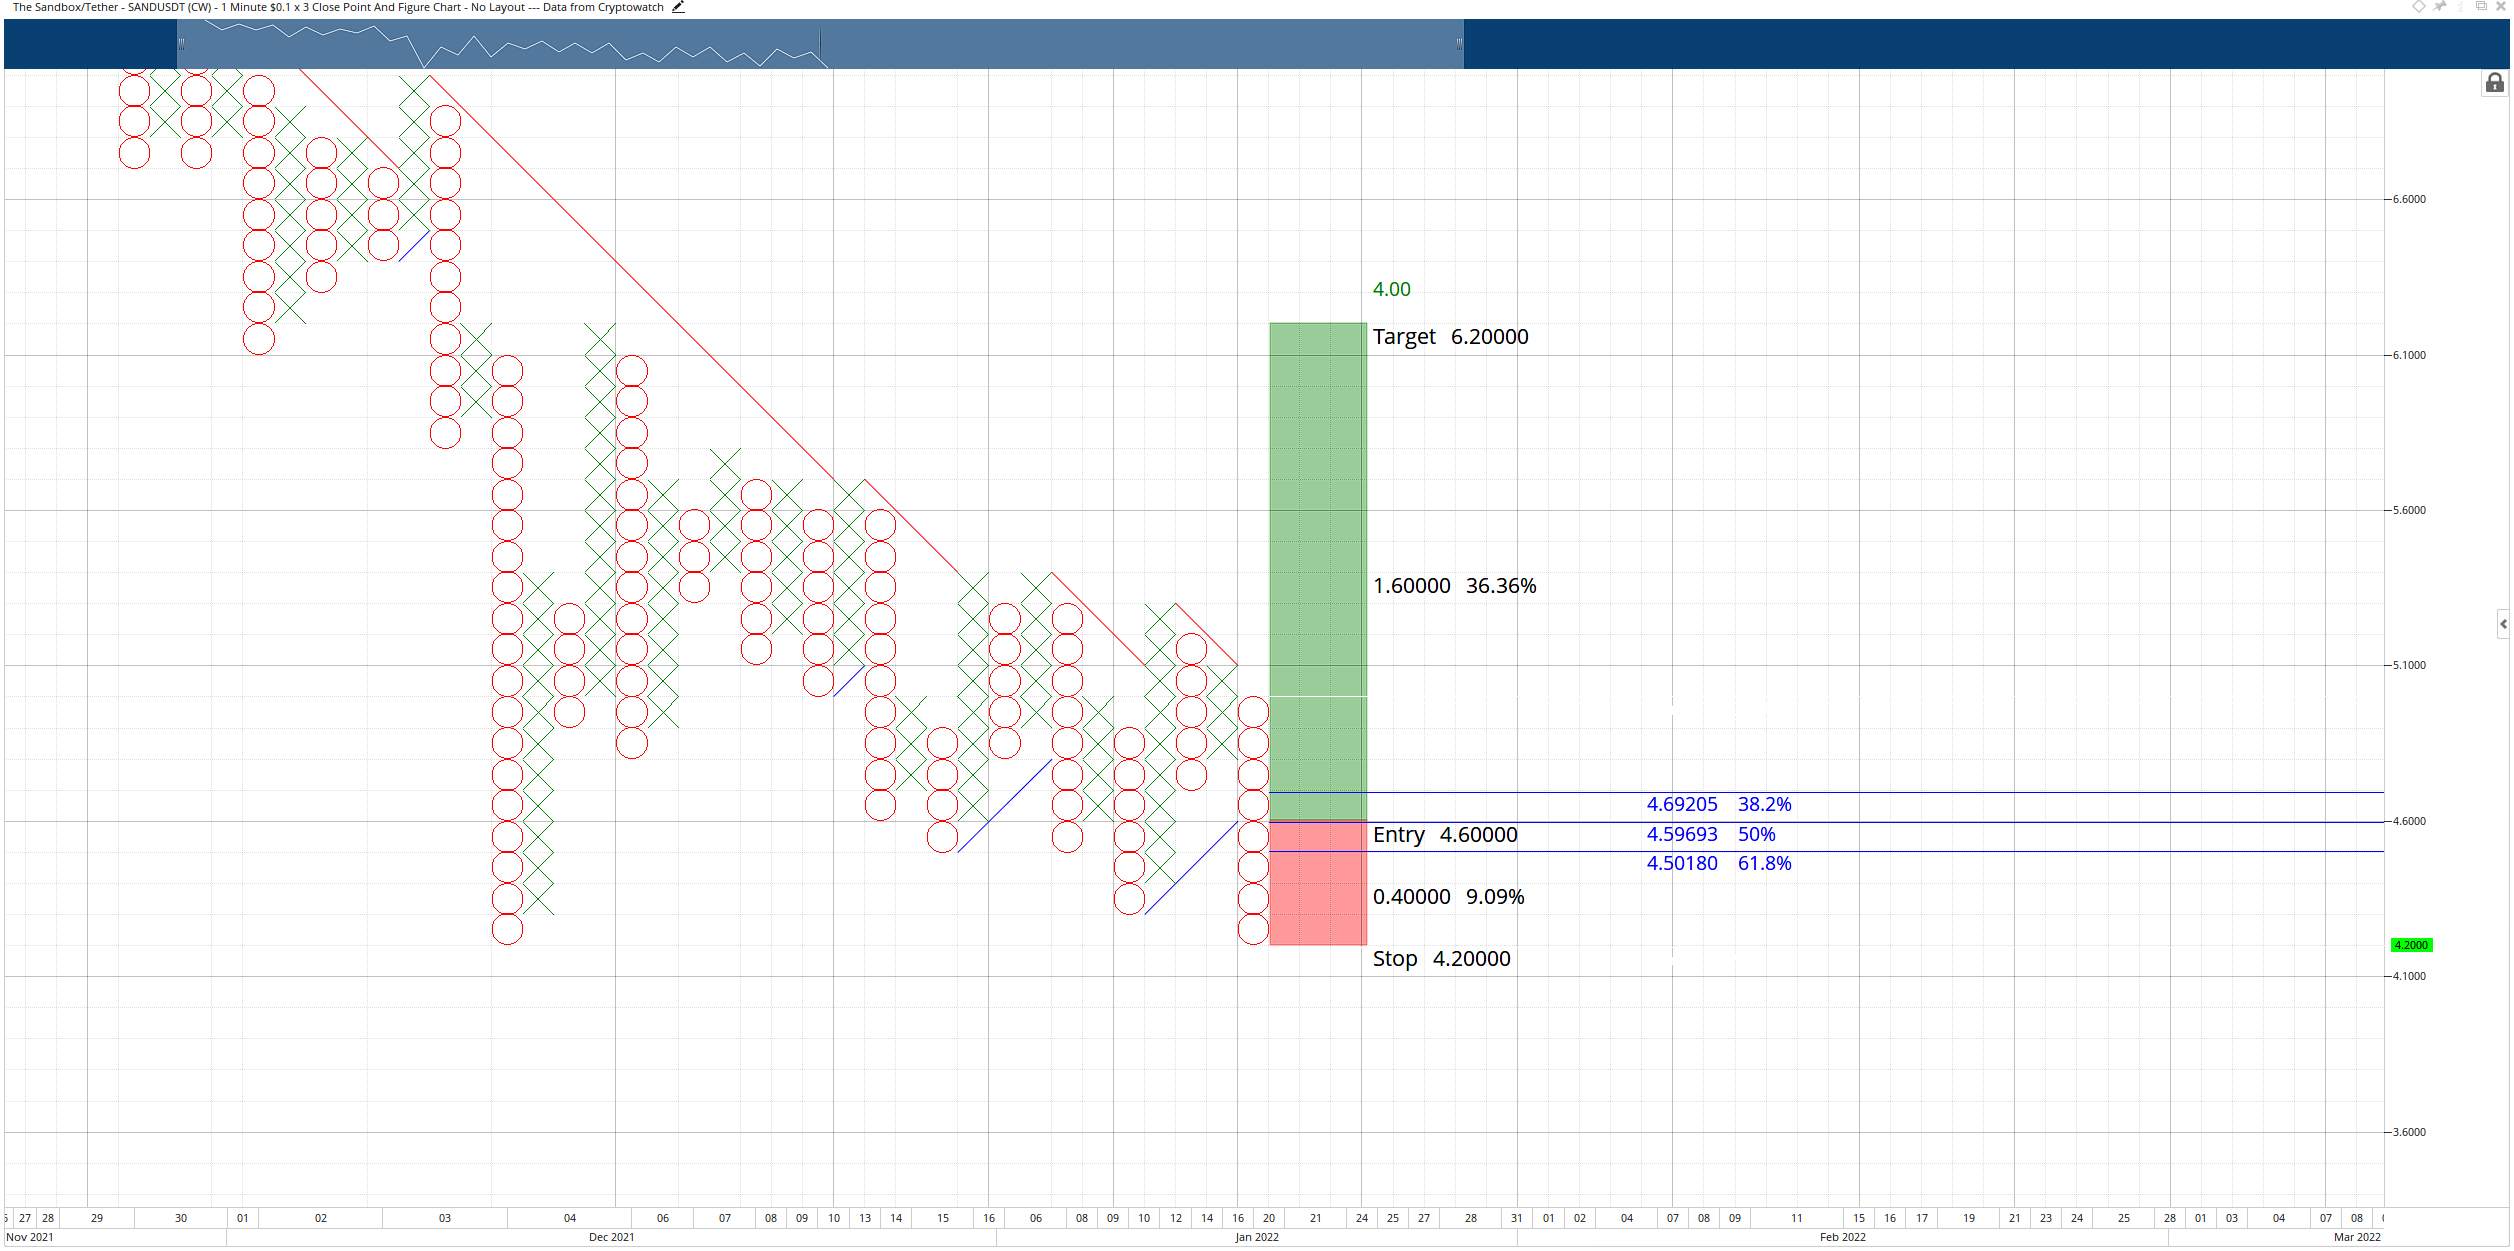
SAND/USDT $0.10/3-box Reversal Point and Figure Chart

The long entry is invalidated if Sandbox price has a daily close at or below the $3.80 value area.

Author

Jonathan Morgan

Jonathan Morgan

Independent Analyst

Jonathan has been working as an Independent future, forex, and cryptocurrency trader and analyst for 8 years. He also has been writing for the past 5 years.

More from Jonathan Morgan
Share:

Editor's Picks

Top 3 Price Prediction: Bitcoin, Ethereum, Ripple deepen sell-off as bears take control of momentum

Bitcoin, Ethereum, and Ripple continued their corrections on Friday, posting weekly losses of nearly 6%, 3%, and 5%, respectively. BTC is nearing the November lows at $80,000, while ETH slips below $2,800 amid increasing downside pressure.

Shiba Inu Price Forecast: SHIB extends losses as whale selling intensifies bearish momentum

Shiba Inu (SHIB) price slips below $0.0000077 on Thursday after correcting the previous day. Bearish sentiment is further strengthened as holders offload SHIB, increasing selling pressure and reducing Open Interest in the derivatives market.

Top Crypto Losers: Worldcoin, Chiliz, Hyperliquid lead losses as market bleeds $1.75 billion

Worldcoin , Chiliz , and Hyperliquid posted heavy losses over the last 24 hours as Bitcoin dropped below $82,000 on Friday, triggering a $1.75 billion wipeout and mirroring the bearish tremors in the US stock market.

Fidelity unveils FIDD stablecoin, set to launch in coming weeks

Fidelity Investments announced that it will launch its first stablecoin, the Fidelity Digital Dollar (FIDD), making it one of the first large traditional firms in the US to do so.

Bitcoin Price Annual Forecast: BTC holds long-term bullish structure heading into 2026

Bitcoin (BTC) is wrapping up 2025 as one of its most eventful years, defined by unprecedented institutional participation, major regulatory developments, and extreme price volatility.

Bitcoin: BTC correction deepens as Fed stance, US-Iran risks, mining disruptions weigh

Bitcoin (BTC) price extends correction, trading below $82,000 after sliding more than 5% so far this week. The bearish price action in BTC was fueled by fading institutional demand, as evidenced by spot Exchange-Traded Funds (ETFs), which recorded $978 million in inflows through Thursday.