Sandbox price prepares for a 25% advance as SAND approaches a crucial barrier
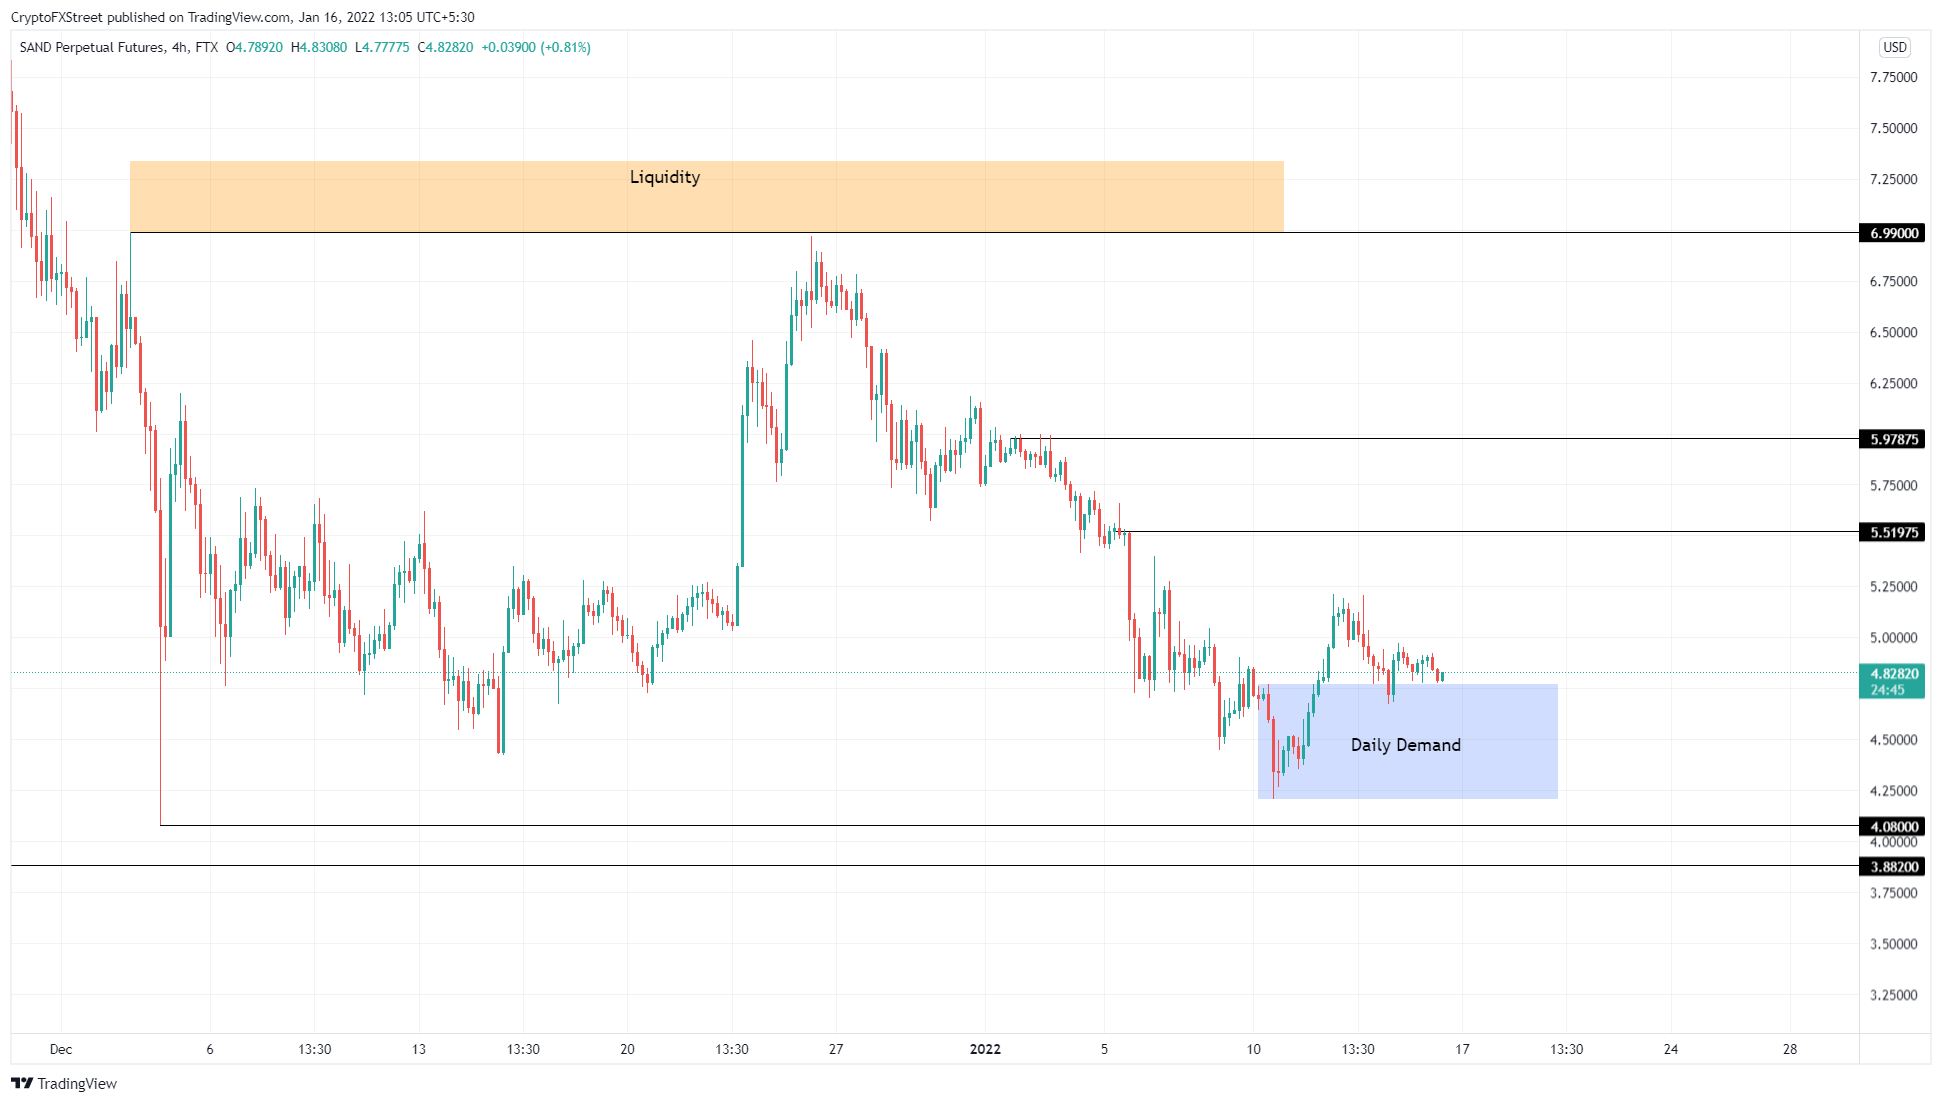
- Sandbox price set up a $4.21 to $4.77 daily demand zone as it rallied 23% between January 10 and January 12.
- The resulting upswing has retraced to retest the said barrier, anticipating a 25% ascent to $6.
- A breakdown of the $4.21 support level will invalidate the bullish thesis for SAND.

Sandbox price sets up a platform for buyers to spark a bull rally. Interestingly, a crucial support level is present to facilitate the origins of such an outlook for SAND.
Sandbox price ready for a move higher
Sandbox price left a demand zone, stretching from $4.21 to $4.77 as it surged nearly 23% between January 10 and January 12. This uptrend lacked the bullish momentum to keep going, resulting in a minor retracement that tagged the aforementioned barrier twice.
The latest retest is currently in place and will likely result in a rally. Investors can expect Sandbox price to retest the $5.52 resistance barrier first, which would indicate a 16% uptrend.
Clearing this hurdle will open the path to retest a crucial psychological level at $6, where Sandbox price is likely to set up a local top.
The medium-term outlook for Sandbox price shows that the market makers are likely to push SAND to $7 and higher to collect the buy-stop liquidity resting above the double top formation. However, market participants must note that this target would play out in a medium-to-long-term outlook.
SAND/USDT 4-hour chart
Regardless of the bullish outlook, Sandbox price needs to hold above the recently formed demand zone, extending from $4.21 to $4.77. Holding this support area is key in shaping an uptrend.
However, a four-hour candlestick close below the $4.21 support level will create a lower low, shifting the odds in the bears’ favor. This development could likely witness massive selling pressure, invalidating the bullish thesis for SAND.
This development could trigger a crash to $4.08 or $3.88, where Sandbox buyers could attempt another uptrend.
Author

Akash Girimath
FXStreet
Akash Girimath is a Mechanical Engineer interested in the chaos of the financial markets. Trying to make sense of this convoluted yet fascinating space, he switched his engineering job to become a crypto reporter and analyst.


