- Ripple stablecoin page is live on the official website on August 4.
- XRP traders are awaiting a ruling in the SEC lawsuit, in its Q2 2024 report Ripple discussed the legal battle.
- XRP extended losses by 1% and the altcoin’s value is down nearly 8% in the past week.
Ripple (XRP) added information on its stablecoin to its official website. The stablecoin is slated for launch later this year. Ripple CEO Brad Garlinghouse has commented on the stablecoin, its utility and Ripple’s plan for the asset during his recent television appearances.
XRP trades at $0.5475 at the time of writing, losing key psychological support at $0.60.
Ripple updates and what to expect
Securities & Exchange Commission (SEC) lawsuit against Ripple drags on and XRP traders await a final ruling in the case. Judge Analisa Torres is expected to rule on the SEC’s allegations that Ripple sold unregistered securities (XRP) to institutional investors, and rule on the fine or settlement amount.
In its Q2 2024 report, Ripple said that the firm is positive that the SEC is unlikely to appeal XRP “non-security” status and the altcoin has legal clarity.
Ripple’s stablecoin details have been made official on the firm’s website, as of August 4. The website issues a disclaimer that the stablecoin will be available subject to “regulatory approval.”
Ripple describes its stablecoin as a means to hold, buy and trade USD on-chain and for payments. Ripple’s RLUSD is being designed to maintain its peg with 1 USD and will be issued on both the XRP Ledger and the Ethereum blockchain.
XRP could extend losses by nearly 9%
XRP could extend losses by 8.35% and sweep liquidity at the support level of $0.50. Once Ripple dips into the imbalance zone between $0.4780 and $0.5136, it could fill the inefficiency and attempt a recovery.
Ripple could rally towards its target of $0.70 post the correction. The Moving Average Convergence Divergence (MACD) indicator supports the thesis of further decline in XRP price. The red histogram bars on the neutral line are indicative of underlying bearish momentum.
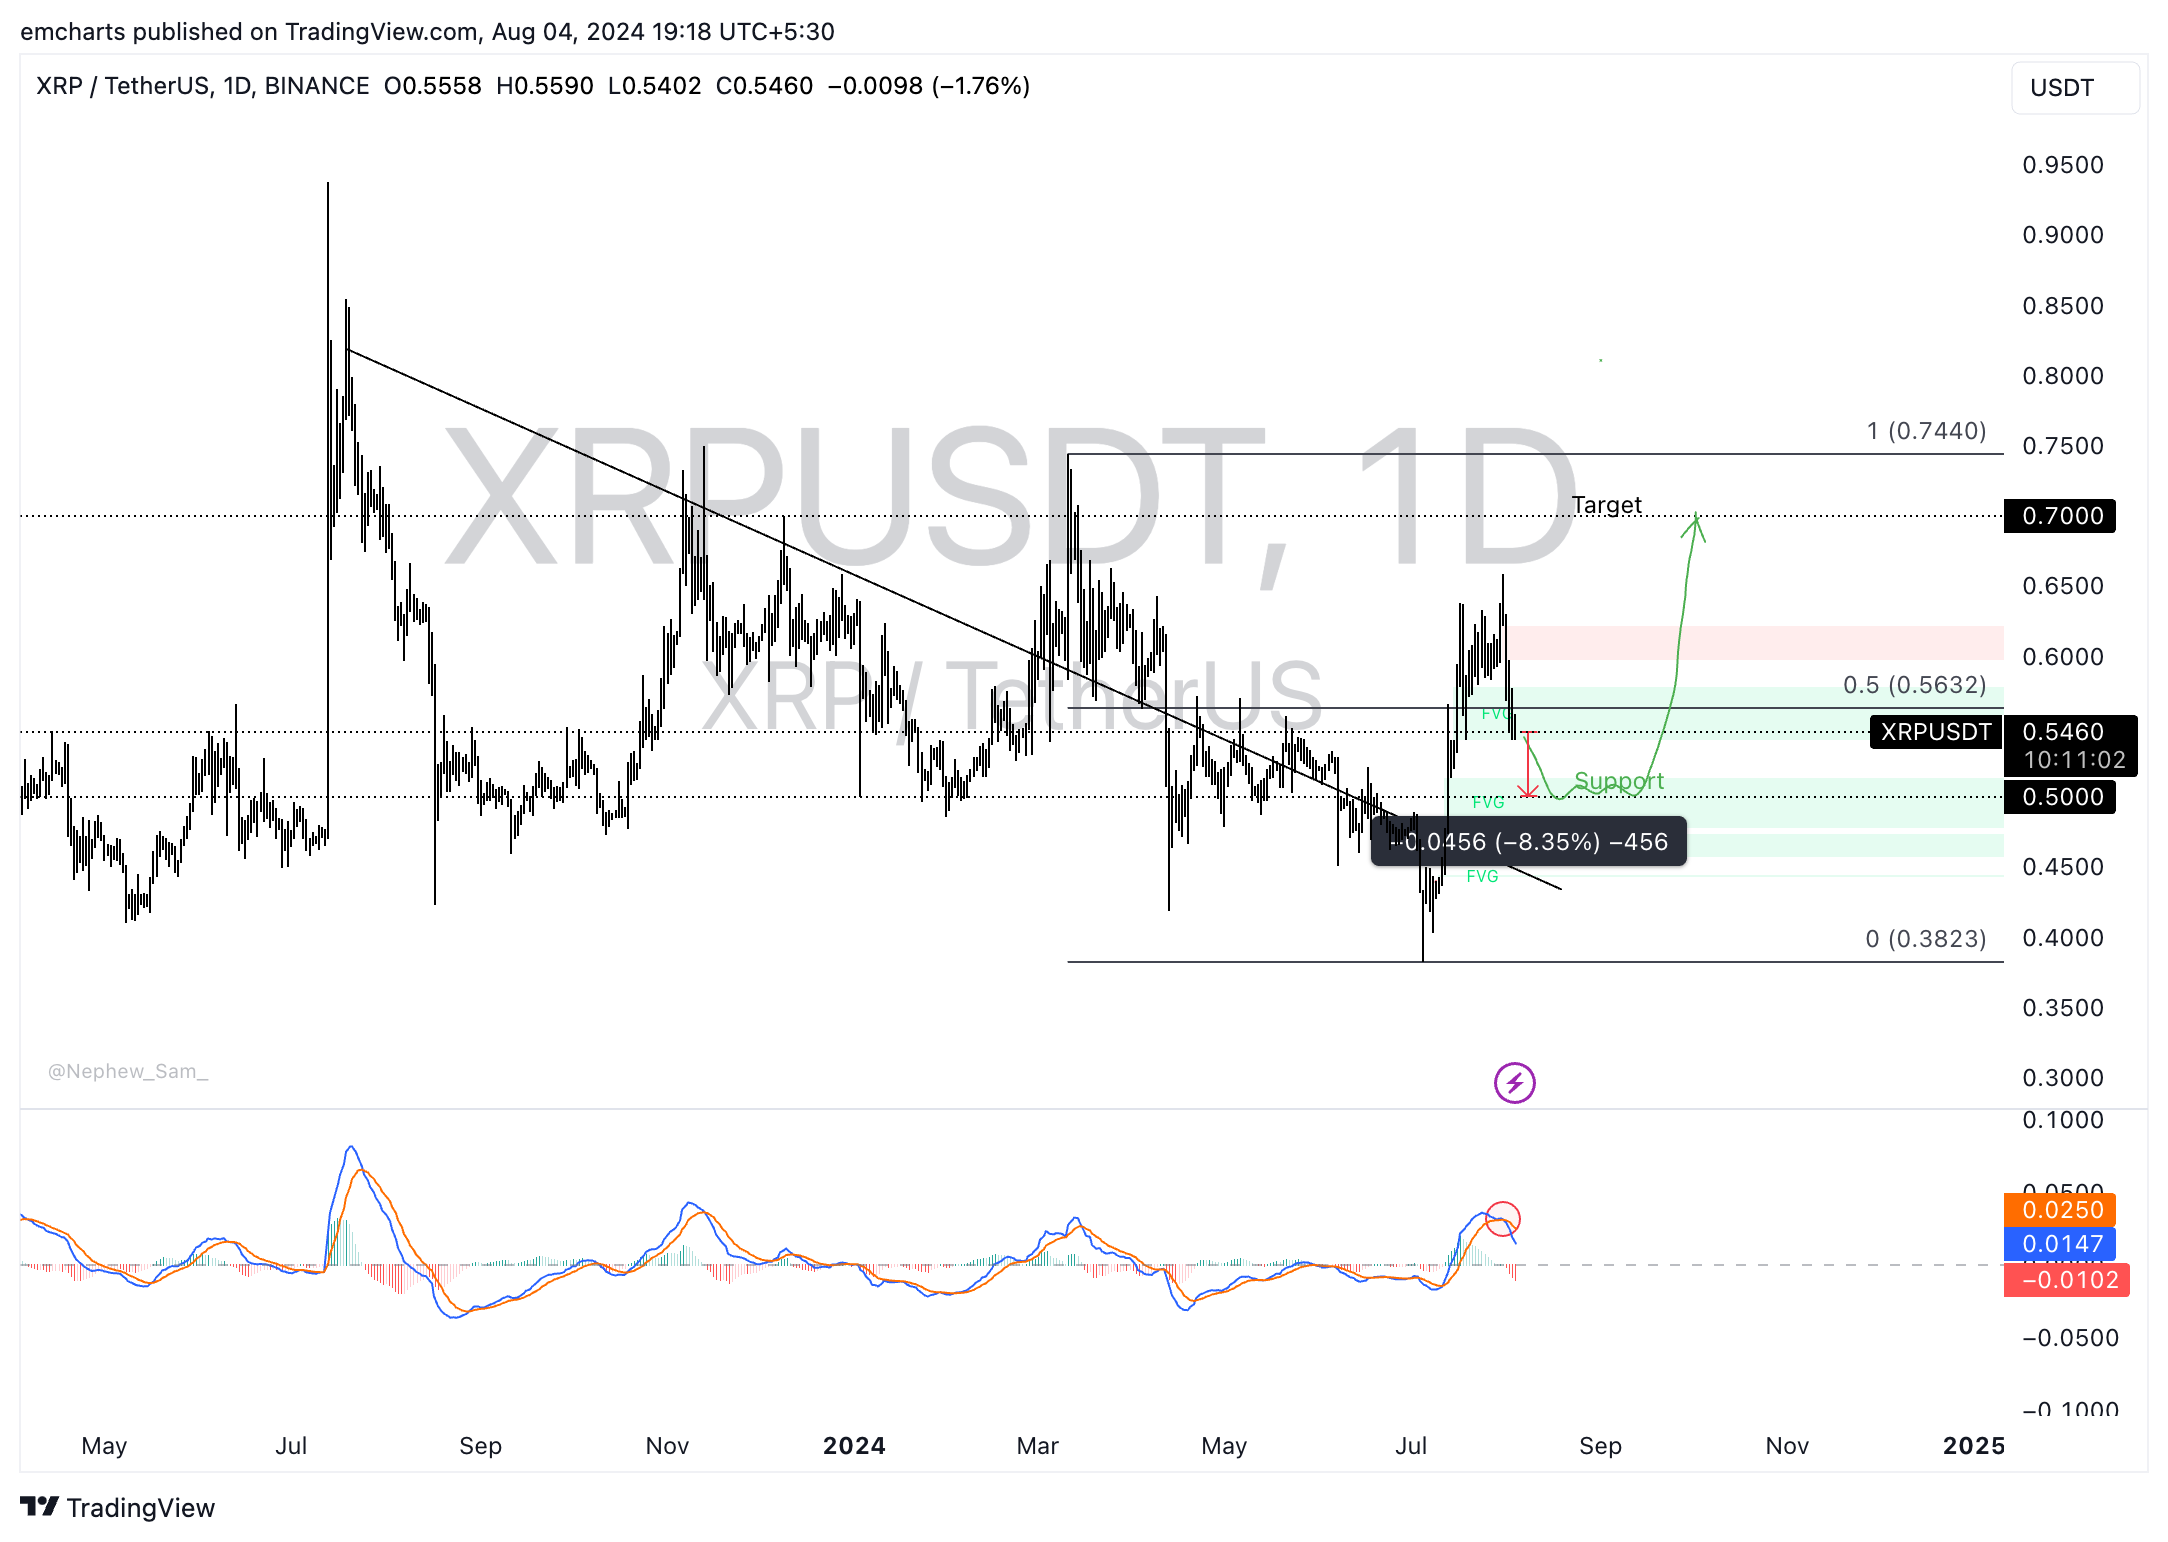
XRP/USDT daily chart
A daily candlestick close above $0.5632, the 50% Fibonacci retracement of the decline from the March 11 of $0.7440 and July 5 low of $0.3823, could invalidate the bearish thesis.
Information on these pages contains forward-looking statements that involve risks and uncertainties. Markets and instruments profiled on this page are for informational purposes only and should not in any way come across as a recommendation to buy or sell in these assets. You should do your own thorough research before making any investment decisions. FXStreet does not in any way guarantee that this information is free from mistakes, errors, or material misstatements. It also does not guarantee that this information is of a timely nature. Investing in Open Markets involves a great deal of risk, including the loss of all or a portion of your investment, as well as emotional distress. All risks, losses and costs associated with investing, including total loss of principal, are your responsibility. The views and opinions expressed in this article are those of the authors and do not necessarily reflect the official policy or position of FXStreet nor its advertisers. The author will not be held responsible for information that is found at the end of links posted on this page.
If not otherwise explicitly mentioned in the body of the article, at the time of writing, the author has no position in any stock mentioned in this article and no business relationship with any company mentioned. The author has not received compensation for writing this article, other than from FXStreet.
FXStreet and the author do not provide personalized recommendations. The author makes no representations as to the accuracy, completeness, or suitability of this information. FXStreet and the author will not be liable for any errors, omissions or any losses, injuries or damages arising from this information and its display or use. Errors and omissions excepted.
The author and FXStreet are not registered investment advisors and nothing in this article is intended to be investment advice.
Recommended Content
Editors’ Picks

Top 3 gainers Supra, Cosmos Hub, EOS: Supra leads recovery after Trump’s tariffs announcement
Supra’s 25% surge on Friday calls attention to lesser-known cryptocurrencies as Bitcoin, Ethereum and XRP struggle. Cosmos Hub remains range-bound while bulls focus on a potential inverse head-and-shoulders pattern breakout.

Bitcoin Weekly Forecast: Tariff ‘Liberation Day’ sparks liquidation in crypto market
Bitcoin price remains under selling pressure around $82,000 on Friday after failing to close above key resistance earlier this week. Donald Trump’s tariff announcement on Wednesday swept $200 billion from total crypto market capitalization and triggered a wave of liquidations.

Can Maker break $1,450 hurdle as whales launch buying spree?
Maker is back above $1,300 on Friday after extending its lower leg to $1,231 the previous day. MKR’s rebound has erased the drawdown that followed United States President Donald Trump’s ‘Liberaton Day’ tariffs on Wednesday, which targeted 100 countries.

Gold shines in Q1 while Bitcoin stumbles
Gold gains nearly 20%, reaching a peak of $3,167, while Bitcoin nosedives nearly 12%, reaching a low of $76,606, in Q1 2025. In Q1, the World Gold ETF's net inflows totalled 155 tonnes, while the Bitcoin spot ETF showed a net inflow of near $1 billion.

Bitcoin Weekly Forecast: Tariff ‘Liberation Day’ sparks liquidation in crypto market
Bitcoin (BTC) price remains under selling pressure and trades near $84,000 when writing on Friday after a rejection from a key resistance level earlier this week.

The Best brokers to trade EUR/USD
SPONSORED Discover the top brokers for trading EUR/USD in 2025. Our list features brokers with competitive spreads, fast execution, and powerful platforms. Whether you're a beginner or an expert, find the right partner to navigate the dynamic Forex market.