|

Ripple Technical Analysis: XRP/USD on the verge of plummeting to $0.10

  • XRP/USD has been generally weaker than the rest of cryptocurrencies.
  • There aren’t many support levels nearby for XRP.

It’s quite obvious for anyone watching XRP charts that the digital asset is really weak and continues dropping every day. On June 27, XRP lost an old support level at $0.174 plummeting to $0.169. 

XRP/USD daily chart

xrpusd

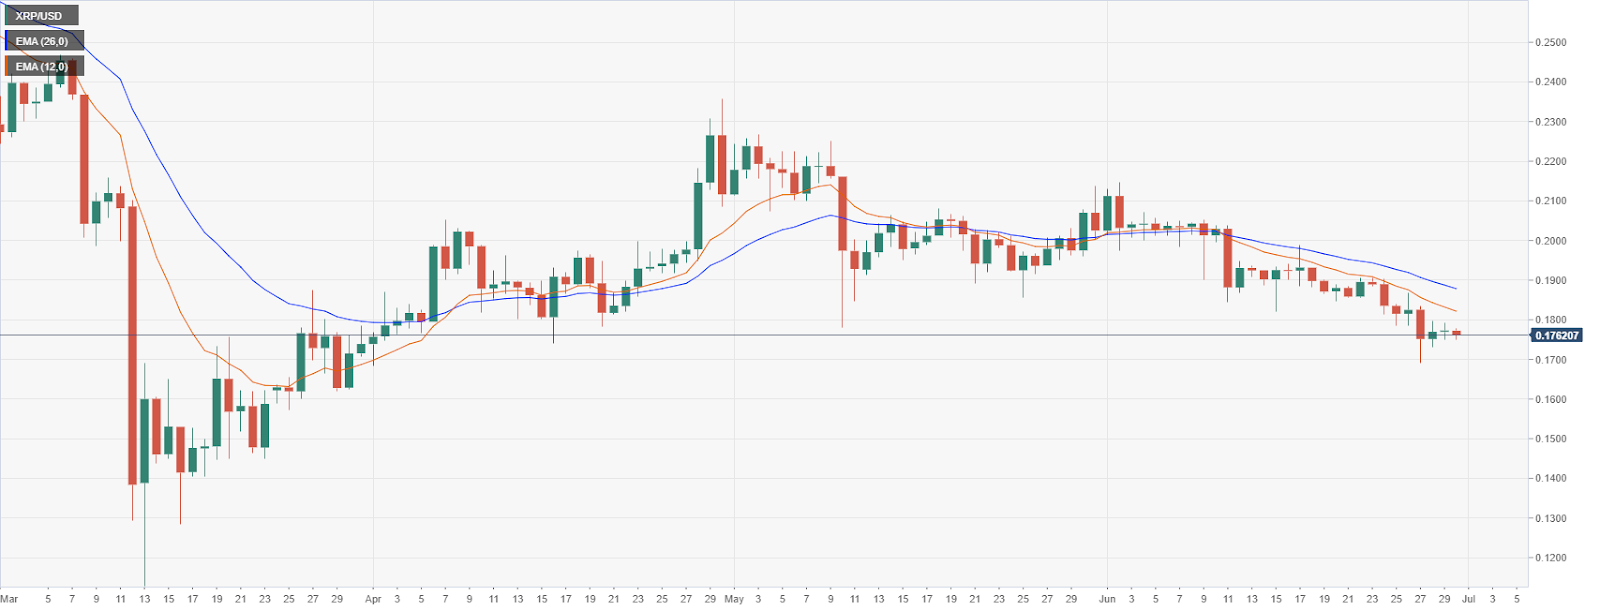
Unfortunately, there aren’t that many support levels on the way down for XRP. On March 29, buyers established a support point at $0.162. After that, the next important support level is set at $0.144 followed by basically $0.112, the low of March 13. These are not huge support levels as XRP was only bouncing back up following Bitcoin’s moves. 

XRP/USD 4-hour chart

xrpusd

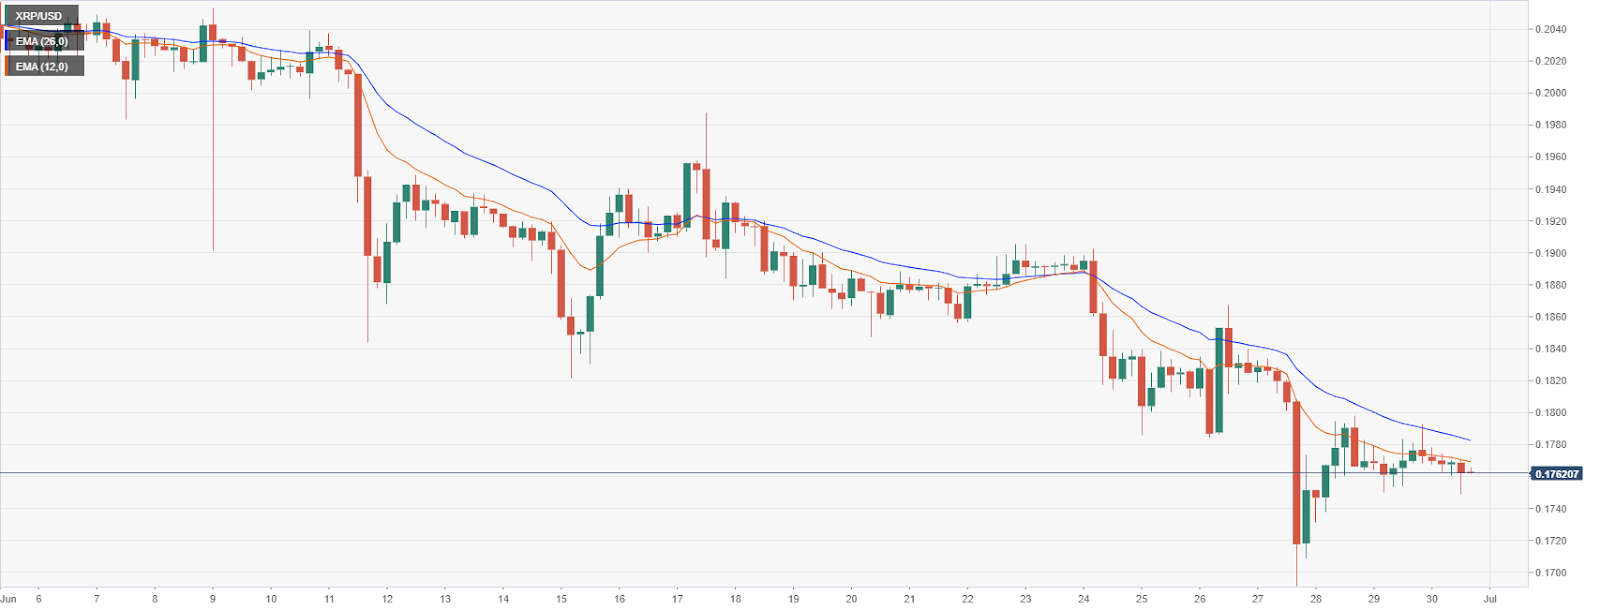
Buyers tried to establish a 4-hour uptrend like most of the other coins but failed to do so. However, bears did see a fakeout to $0.1749 before recovering to $0.176. The 12-EMA at $0.1769 has acted as a strong resistance level for the past six days. 

Author

Lorenzo Stroe

Lorenzo Stroe

Independent Analyst

Lorenzo is an experienced Technical Analyst and Content Writer who has been working in the cryptocurrency industry since 2012. He also has a passion for trading.

More from Lorenzo Stroe
Share:

Editor's Picks

Ripple technical weakness persists as selling intensifies toward $1.00

Ripple grinds lower, trading around $1.10 at the time of writing on Wednesday. The sticky bearish outlook mirrors the broader crypto market, with major coins such as Bitcoin and Ethereum facing weak demand as investors de-risk.

Crypto Today: Bitcoin, Ethereum, XRP face downside pressure amid investor de-risking

Major crypto assets trade under intense headwinds on Wednesday, as market participants navigate complex geopolitical and macroeconomic environments. Bitcoin has slipped toward $61,000 after its recent rebound was sold near $64,000, leaving buyers exhausted.

Bitcoin Price Forecast: Sticky inflation fears threaten deeper sell-off in BTC

Bitcoin extends its decline on Wednesday, trading below $61,500 at the time of writing as renewed US-Iran tensions keep the risk sentiment capped. In addition, persistent capital outflows from US-listed spot Exchange Traded Funds continue to fuel selling pressure on BTC.

Pi Network extends decline as CEX outflows fail to offset bearish pressure

Pi Network edges lower on Wednesday, extending its third consecutive day of losses. The technical outlook for PI is largely bearish, with a risk of a steeper correction below $0.1184.

Bitcoin: After the bloodbath, everyone looks at $60,000
Bitcoin (BTC) hovers above $62,000 at the time of writing on Friday, weighed down by growing risk-off sentiment due to persistent geopolitical tensions in the Middle East and sticky macroeconomic uncertainty. The institutional sell-off continued to wreak havoc on capital flows, with spot Bitcoin Exchange-Traded Funds (ETFs) recording billions in outflows.