- Quant price has been on a steady downtrend since the year began, falling 45% between February and September.
- On-chain data shows that 61.11% of QNT holders remain in profit, against 37.34% sitting on unrealized losses.
- The profit cohort constitutes traders who bought the altcoin at an average price of $47.47, totaling 14,070 addresses.
- It indicates only long-term holders are currently in profit, considering the last time the token traded that low was in 2022.
Quant (QNT) price is trading with a bearish bias, a steady state that has prevailed for the most part of the year. Despite the downtrend, the majority of QNT token holders remain above water, sitting on unrealized profit.
Also Read: Bitcoin and Quant deviate again
Quant price steadily declines; long-term holders remain in profit
Quant (QNT) price has recorded a steady stream of lower highs and lower lows since early February, with the price action consolidating along a descending parallel channel. During the same time, Bitcoin price has managed to maintain a sustained overall uptrend, pointing to a significant deviation between the two risk assets.
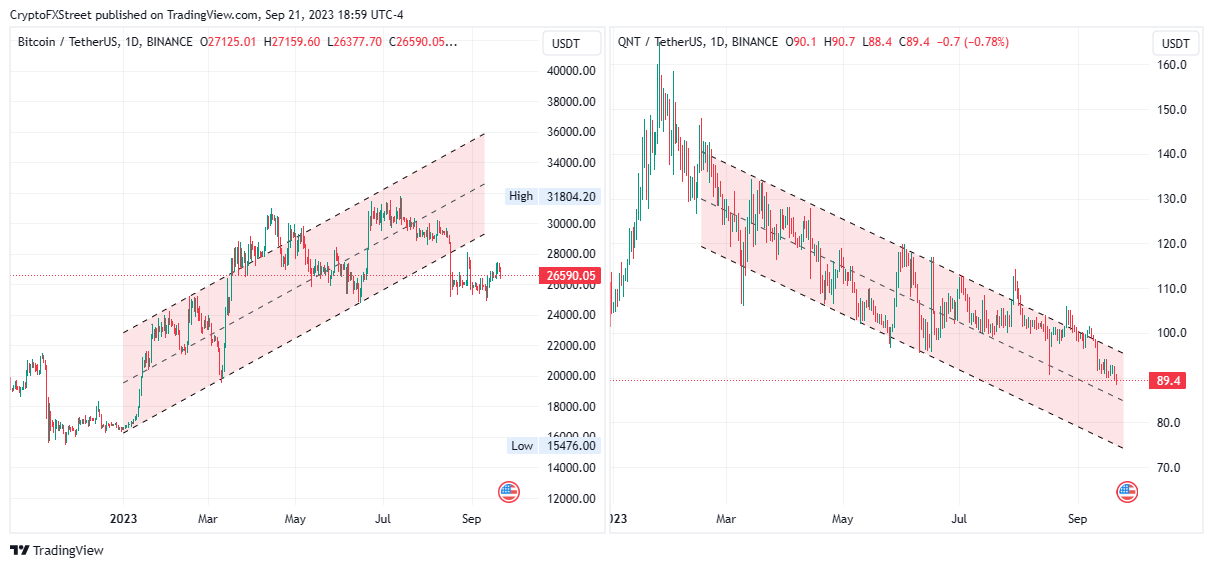
BTC/USDT 1-day chart, QNT/USDT 1-day chart
Momentum indicators such as the Relative Strength Index (RSI) and the Awesome Oscillator (AO) bolster the case to the downside showing dwindling momentum.
For as long as Quant price remains confined within the walls of this bearish channel, QNT is bound to lose more value. The token is currently sitting on the support provided by the midline of the pattern at around the $89.3 level, with the next line of defense presenting around the $80.0 psychological level, marked by the lower boundary of the channel.
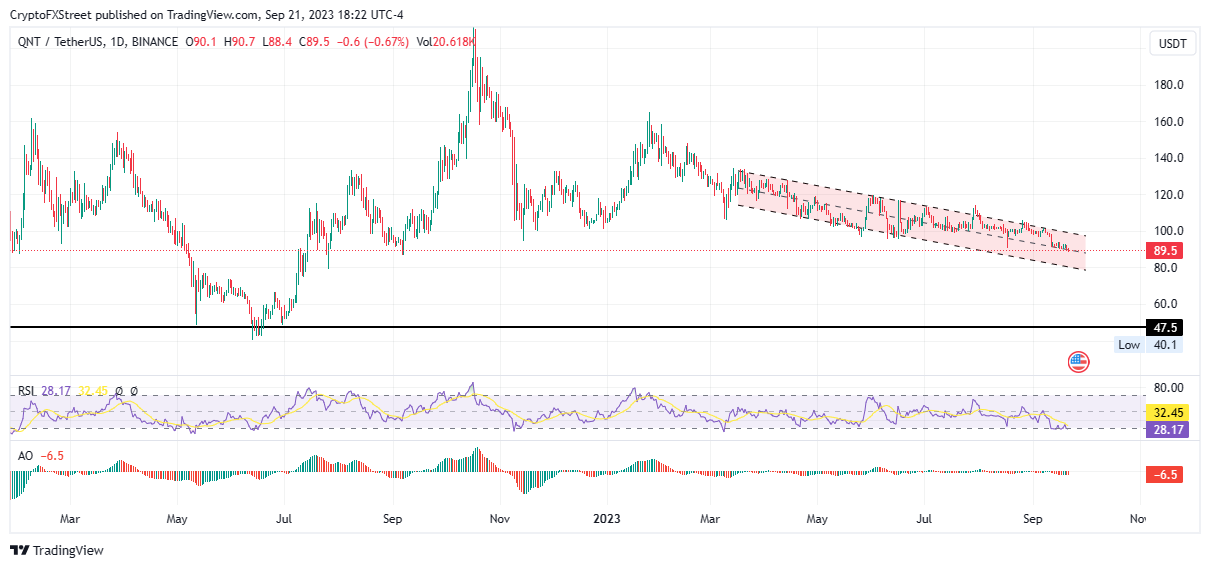
QNT/USDT 1-day chart
Meanwhile, IntoTheBlock, a blockchain analytics platform that provides real-time on-chain analytics and market intelligence on crypto assets, shows that despite the sustained or longstanding slump, the majority of QNT token holders are the ones in the profit zone (in the money).
Specifically, the 61.11% of investors holding 14.93 million QNT tokens are sitting on unrealized profit. This is against the 37.34% of token holders, holding 9.12 million holders that are underwater (out of the money) and 1.55% holding 380,120 tokens currently breaking even (at the money).
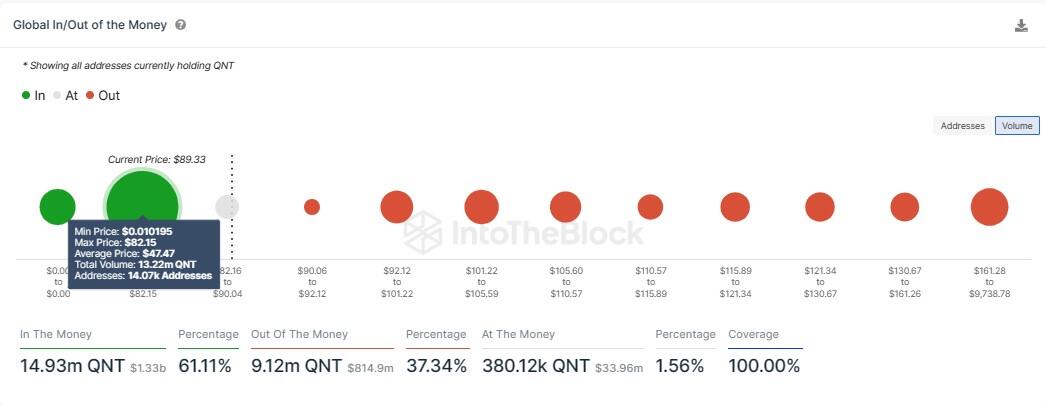
QNT GIOM
In the same way, Quant price has robust support downward, provided by 14,070 addresses that bought approximately 13.22 million QNT tokens at an average price of $47.47. Any efforts to push the altcoin’s price down would be countered by buying pressure from this cohort of investors.
The data also indicates that only long-term holders of the QNT token are currently in profit or above water, considering the last time the price recorded anything around its current value of $89.4 was in September 2022.
Also Read: Bitcoin profitable days shows that in the long run holding is usually a solid strategy
Cryptocurrency metrics FAQs
What is circulating supply?
The developer or creator of each cryptocurrency decides on the total number of tokens that can be minted or issued. Only a certain number of these assets can be minted by mining, staking or other mechanisms. This is defined by the algorithm of the underlying blockchain technology. Since its inception, a total of 19,445,656 BTCs have been mined, which is the circulating supply of Bitcoin. On the other hand, circulating supply can also be decreased via actions such as burning tokens, or mistakenly sending assets to addresses of other incompatible blockchains.
What is market capitalization?
Market capitalization is the result of multiplying the circulating supply of a certain asset by the asset’s current market value. For Bitcoin, the market capitalization at the beginning of August 2023 is above $570 billion, which is the result of the more than 19 million BTC in circulation multiplied by the Bitcoin price around $29,600.
What is trading volume?
Trading volume refers to the total number of tokens for a specific asset that has been transacted or exchanged between buyers and sellers within set trading hours, for example, 24 hours. It is used to gauge market sentiment, this metric combines all volumes on centralized exchanges and decentralized exchanges. Increasing trading volume often denotes the demand for a certain asset as more people are buying and selling the cryptocurrency.
What is funding rate?
Funding rates are a concept designed to encourage traders to take positions and ensure perpetual contract prices match spot markets. It defines a mechanism by exchanges to ensure that future prices and index prices periodic payments regularly converge. When the funding rate is positive, the price of the perpetual contract is higher than the mark price. This means traders who are bullish and have opened long positions pay traders who are in short positions. On the other hand, a negative funding rate means perpetual prices are below the mark price, and hence traders with short positions pay traders who have opened long positions.
Information on these pages contains forward-looking statements that involve risks and uncertainties. Markets and instruments profiled on this page are for informational purposes only and should not in any way come across as a recommendation to buy or sell in these assets. You should do your own thorough research before making any investment decisions. FXStreet does not in any way guarantee that this information is free from mistakes, errors, or material misstatements. It also does not guarantee that this information is of a timely nature. Investing in Open Markets involves a great deal of risk, including the loss of all or a portion of your investment, as well as emotional distress. All risks, losses and costs associated with investing, including total loss of principal, are your responsibility. The views and opinions expressed in this article are those of the authors and do not necessarily reflect the official policy or position of FXStreet nor its advertisers. The author will not be held responsible for information that is found at the end of links posted on this page.
If not otherwise explicitly mentioned in the body of the article, at the time of writing, the author has no position in any stock mentioned in this article and no business relationship with any company mentioned. The author has not received compensation for writing this article, other than from FXStreet.
FXStreet and the author do not provide personalized recommendations. The author makes no representations as to the accuracy, completeness, or suitability of this information. FXStreet and the author will not be liable for any errors, omissions or any losses, injuries or damages arising from this information and its display or use. Errors and omissions excepted.
The author and FXStreet are not registered investment advisors and nothing in this article is intended to be investment advice.
Recommended Content
Editors’ Picks
LINK price jumps 10% as Chainlink races toward tokenization of funds

Chainlink (LINK) price has remained range-bound for a while, stuck between the $16.00 roadblock to the upside and $13.08 to the downside. However, in light of recent revelations, the token, which powers the verifiable web of the decentralized computing platform, may have further upside potential.
Gaming token Notcoin down by almost 50% after airdrop launch

NOT experienced a rapid decline hours after its anticipated launch on Thursday, shedding almost 50% of its value. This continues the cycle of huge selling pressure faced by cryptocurrency airdrops after their launch, especially the launch of gaming tokens in recent times.
Ethereum drops below $3,000 again, spot ETH ETF sparks debate in crypto community

Ethereum again went below the $3,000 key level on Thursday after posting signs of a rally. The price action follows predictions from the community regarding the SEC's decision on spot ETH ETFs next week.
SUI price defends $0.8880 amid multiple Sui network integrations
Sui (SUI) price failed to heed to the broader market recovery on Wednesday, extending the fall to the $0.8880 support level. However, with multiple network integrations in the works, the altcoin has pivoted around this level and is scaling a recovery.
Bitcoin: Why BTC is close to a bottom

Bitcoin (BTC) price efforts of a recovery this week have been countered by selling pressure during the onset of the American session. However, the downside potential appears to have been capped.