QTUM price at risk of falling 60%
- QTUM price has held the 10-week simple moving average (SMA) since the beginning of the year.
- Relative Strength Index (RSI) near an overbought reading.
- $6.98 level causing headaches for traders on a weekly closing basis.

QTUM price has plunged 70% on two occasions since the beginning of February 2020, and each previous high has marked the beginning of a rising channel in QTUM. With the cryptocurrency struggling with resistance around $6.98, there is an increased probability that the cryptocurrency could retrace to the lower trendline of the channel, representing a 60% decline from current levels.
QTUM price distribution continues to undermine bullish traders
The decline in February–March 2020 was 77%, and the August–November 2020 crash was 69%. If precedent holds, QTUM may fall an additional 60% before touching the channel’s lower trendline.
Over the last six weeks, QTUM has reversed rally attempts above $6.98. The price level is in line with an area of price congestion going back to late-2017. With the RSI near overbought levels, there is a narrow window for momentum to lift prices higher.
The first price support comes at the 10-week SMA at $5.64, a support level going back to the beginning of this year. A weekly close below the moving average would be detrimental to the bullish outlook and favor a decline to the 40-week SMA at $3.30, followed by a test of the channel’s downside trendline at $2.72. The trendline’s touch would represent a decline of 70% from the February high at $9.68 and a 60% decline from current price levels.
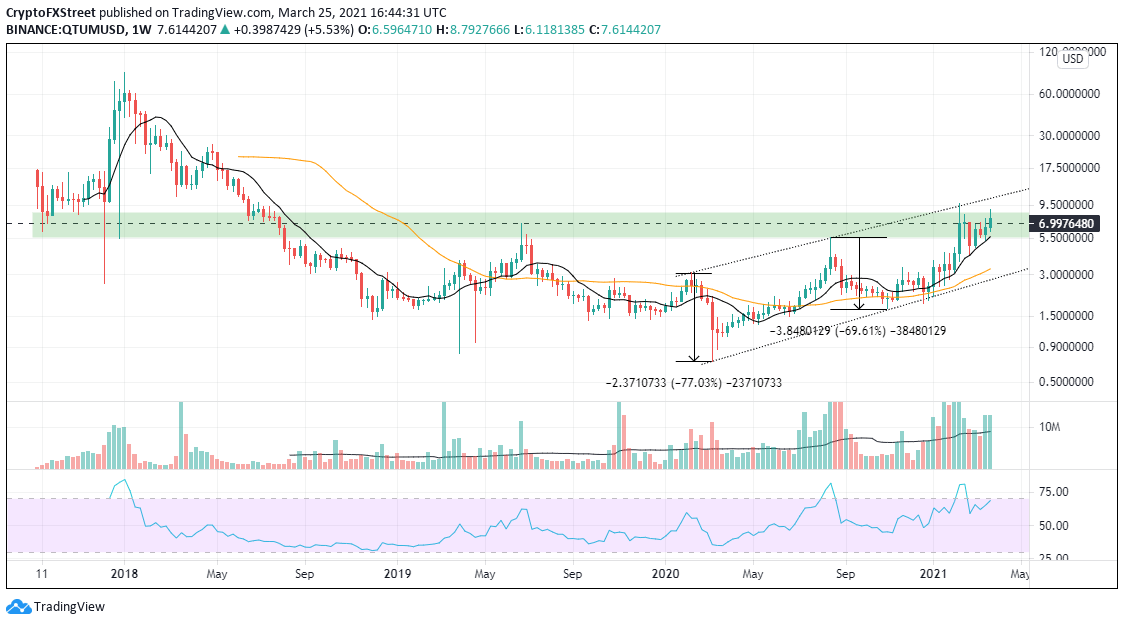
QTUM/USD weekly chart
Now, if the bulls overcome the distribution over $6.98 and can close QTUM firmly above the price level on a weekly basis, then the upside trendline might be in play at $10.64. Be alert to a potential negative RSI divergence with price if a new all-time high is achieved.
Author

Sheldon McIntyre, CMT
Independent Analyst
Sheldon has 24 years of investment experience holding various positions in companies based in the United States and Chile. His core competencies include BRIC and G-10 equity markets, swing and position trading and technical analysis.


