Polygon investors resort to dormancy as MATIC price nears 13-month low for the second time
- MATIC price is inching closer to $0.585, which was recently tested in June and last breached in July 2022.
- MATIC holders' participation has declined by about 60% in the span of two weeks owing to weak price action.
- Investors are likely going to continue holding back since over 88% of all token holders are currently underwater.

MATIC price has been seeing declines for the second half of July, continuing even into August. While pretty much most of the crypto market is suffering, a polygon has managed to emerge as one of the worst performers, and this is reflected in the behavior of its investors.
MATIC price decline leaves investors dormant
MATIC price is currently trading at $0.661 after falling by nearly 23% since mid-July. In doing so, the altcoin fell through the 50-day Exponential Moving Average (EMA) as well as the $0.742 support level. The altcoin is now inching closer to $0.585, the support level that was last tested in June this year. The only time before then was back in July 2022, when the altcoin breached through it to rally ahead.
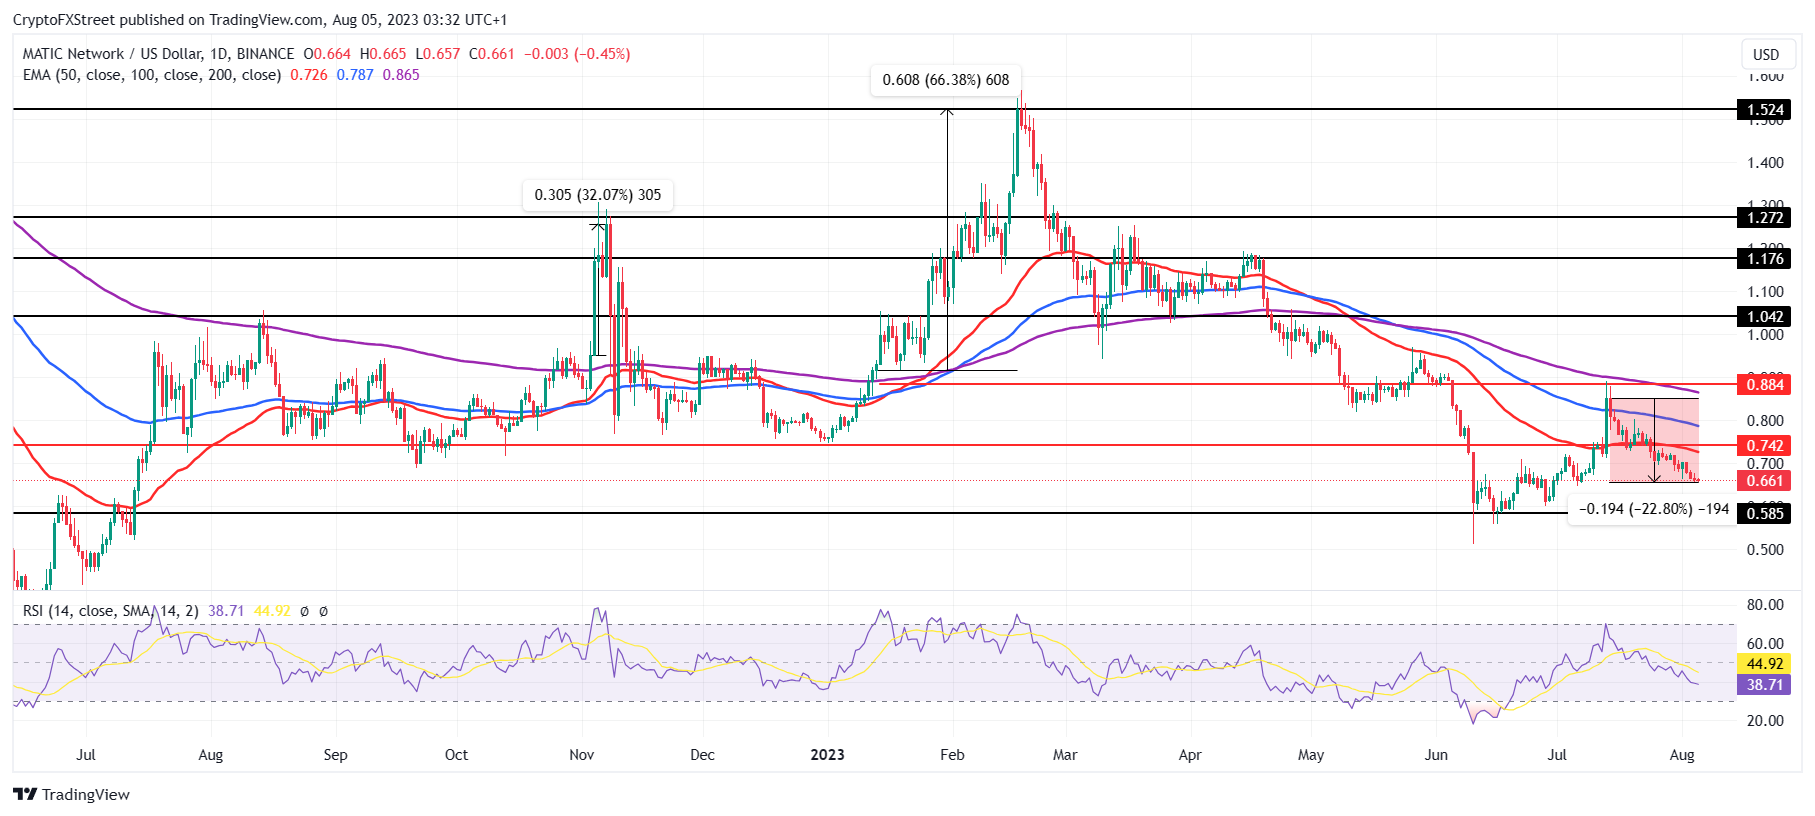
MATIC/USD 1-day chart
However, the waning optimism has left investors pulling back to the point where they are refraining from participating on the network at all. The active addresses, which measure the number of MATIC holders that have conducted transactions on the network, have declined by 60% from 4.5k to 1.8k in just two weeks.
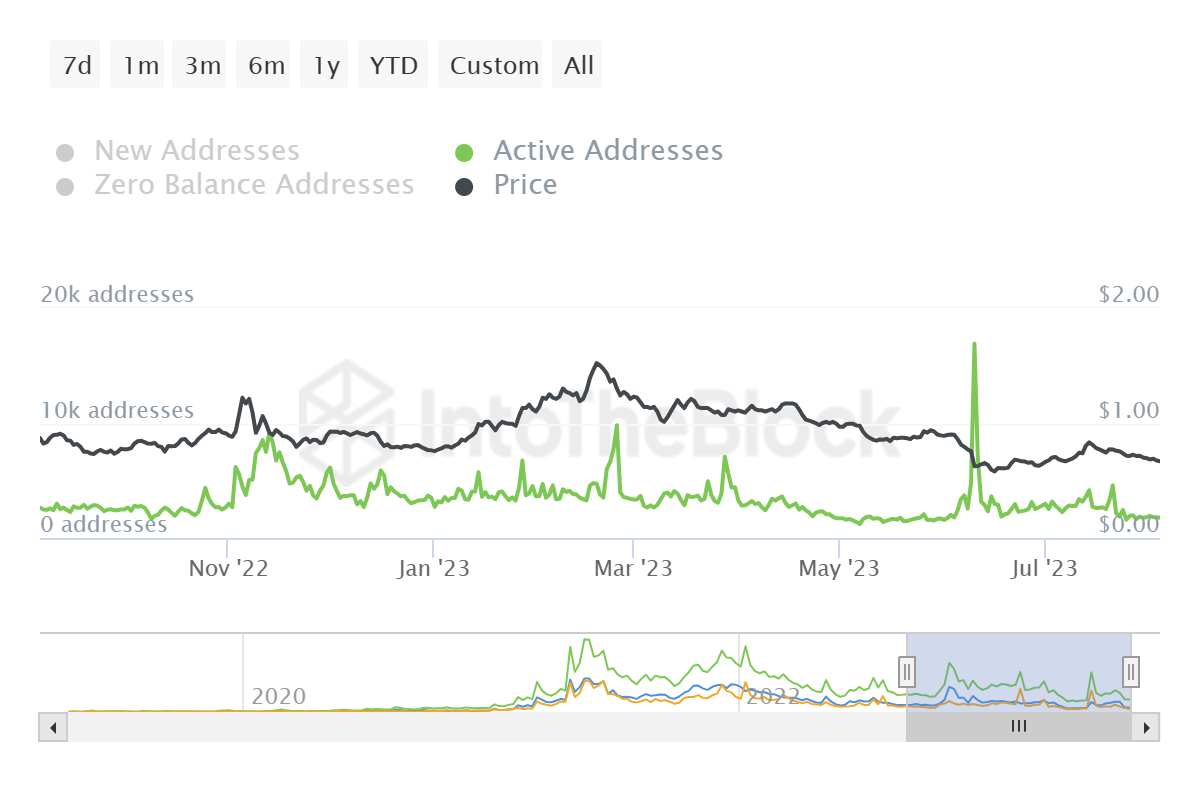
MATIC active addresses
In all fairness, this was expected, too, since Polygon investors are some of the most loss-bearing investors in the entire crypto space. Of the 582k total addresses holding any balance of MATIC, about 88% of them are underwater, while less than 9.5% are observing any gains at all.
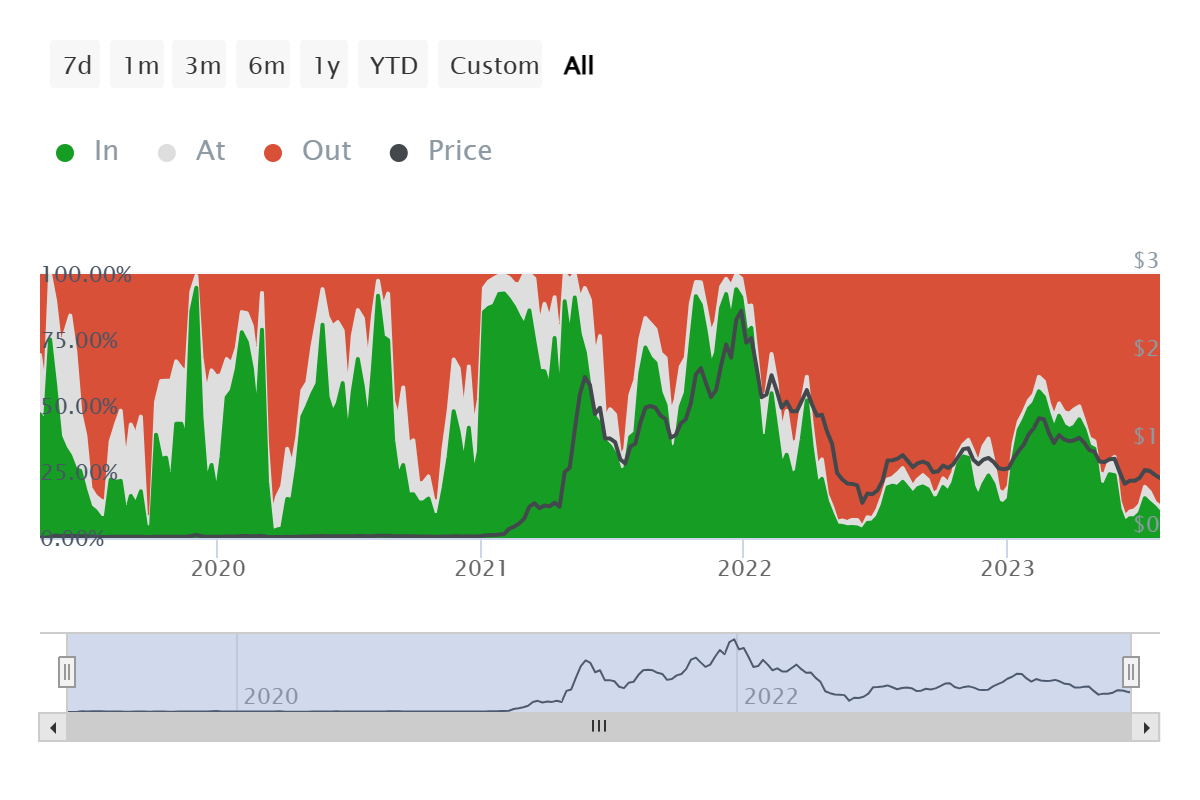
MATIC addresses at a loss
Since they have no incentive to move their supply around, they are willing to sit back and wait for broader market cues or network development to trigger a recovery in the altcoin and bring back their profits.
Looking at the Relative Strength Index (RSI), it is likely that recovery could be a while since the decline of the indicator below the neutral line at 50.0 suggests waning bullishness. This could pull back the altcoin to $0.585, and a bounce back from this level could help in preventing excessive losses.
Cryptocurrency metrics FAQs
What is circulating supply?
The developer or creator of each cryptocurrency decides on the total number of tokens that can be minted or issued. Only a certain number of these assets can be minted by mining, staking or other mechanisms. This is defined by the algorithm of the underlying blockchain technology. Since its inception, a total of 19,445,656 BTCs have been mined, which is the circulating supply of Bitcoin. On the other hand, circulating supply can also be decreased via actions such as burning tokens, or mistakenly sending assets to addresses of other incompatible blockchains.
What is market capitalization?
Market capitalization is the result of multiplying the circulating supply of a certain asset by the asset’s current market value. For Bitcoin, the market capitalization at the beginning of August 2023 is above $570 billion, which is the result of the more than 19 million BTC in circulation multiplied by the Bitcoin price around $29,600.
What is trading volume?
Trading volume refers to the total number of tokens for a specific asset that has been transacted or exchanged between buyers and sellers within set trading hours, for example, 24 hours. It is used to gauge market sentiment, this metric combines all volumes on centralized exchanges and decentralized exchanges. Increasing trading volume often denotes the demand for a certain asset as more people are buying and selling the cryptocurrency.
What is funding rate?
Funding rates are a concept designed to encourage traders to take positions and ensure perpetual contract prices match spot markets. It defines a mechanism by exchanges to ensure that future prices and index prices periodic payments regularly converge. When the funding rate is positive, the price of the perpetual contract is higher than the mark price. This means traders who are bullish and have opened long positions pay traders who are in short positions. On the other hand, a negative funding rate means perpetual prices are below the mark price, and hence traders with short positions pay traders who have opened long positions.
Author

Aaryamann Shrivastava
FXStreet
Aaryamann Shrivastava is a Cryptocurrency journalist and market analyst with over 1,000 articles under his name. Graduated with an Honours in Journalism, he has been part of the crypto industry for more than a year now.


