PancakeSwap Price Forecast: CAKE dips below $2, hitting two-month low, as bearish momentum builds
- PancakeSwap price trades in red, accumulating a 10% decline so far this week.
- Derivatives data show growing bearish sentiment, with declining open interest, negative funding rates and rising short positions.
- The technical outlook suggests further downside, as momentum indicators show bearish pressure gaining traction.

Pancake (CAKE) price remains under pressure midweek, trading below $2 and reaching a two-month low as sellers tighten their grip on the market. The ongoing pullback is strengthening, driven by weakening derivatives sentiment and deteriorating technical momentum, suggesting further downside.
Bearish derivatives signals point to increasing downside pressure
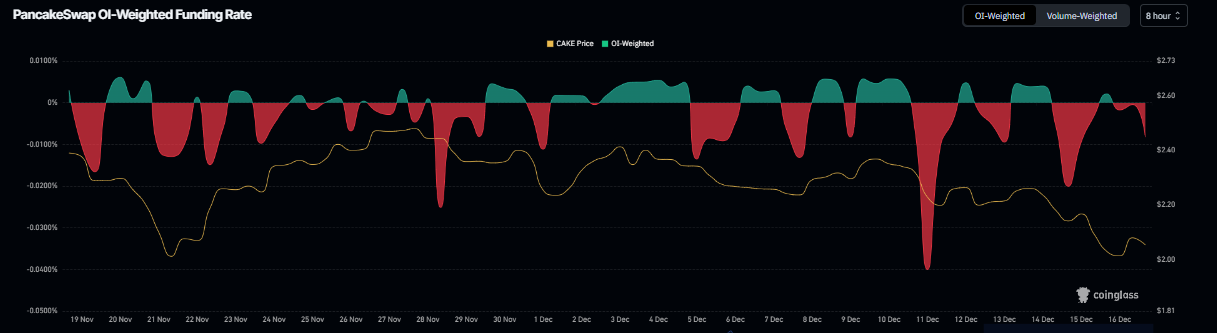
Pancake’s derivatives data support a bearish outlook. Coinglass’s OI-Weighted Funding Rate data show that the number of traders betting that the price of CAKE will slide further exceeds those anticipating a price increase.
The metric flipped to a negative rate on Tuesday, now at -0.005%, suggesting that shorts are paying longs. Historically, when the funding rates have flipped negative, CAKE prices have fallen sharply.
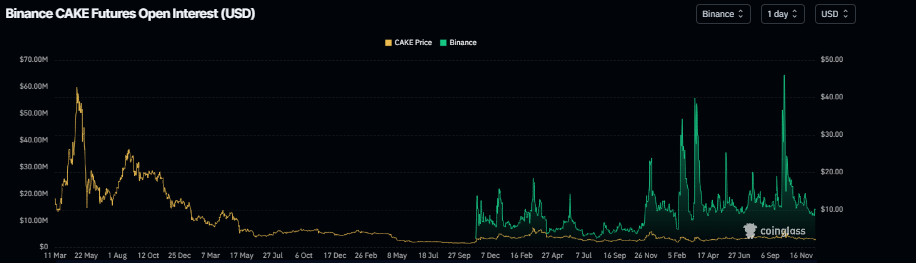
The short-term bearish price action is further supported by CAKE’s declining open interest on Binance, which stood at $14 million on Wednesday, near its yearly low. This declining open interest indicates that traders are closing positions and speculative interest is fading, rather than fresh buying stepping in.
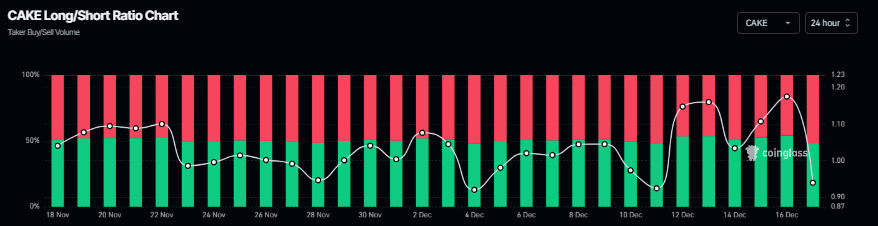
Moreover, the long-to-short ratio of CAKE reads 0.92 on Wednesday. A ratio below one indicates rising bearish sentiment, as traders are betting on the asset price to fall.
Pancake Price Forecast: CAKE momentum indicators show bearish bias
Pancake price was rejected from the 50-day Exponential Moving Average (EMA) at $2.36 on December 9 and declined 14% by Tuesday. This level coincides with the descending trendline, making this a key resistance zone. As of Wednesday, CAKE slips more than 6%, reaching a new two-month low of $1.88.
If CAKE continues its downward trend, it could extend the decline toward the October 10 low of $1.51.
The Relative Strength Index (RSI) on the daily chart reads 31, nearing oversold territory, indicating strong bearish momentum. Additionally, the Moving Average Convergence Divergence (MACD) indicator showed a bearish crossover on Sunday, which remains intact, further supporting the negative outlook.
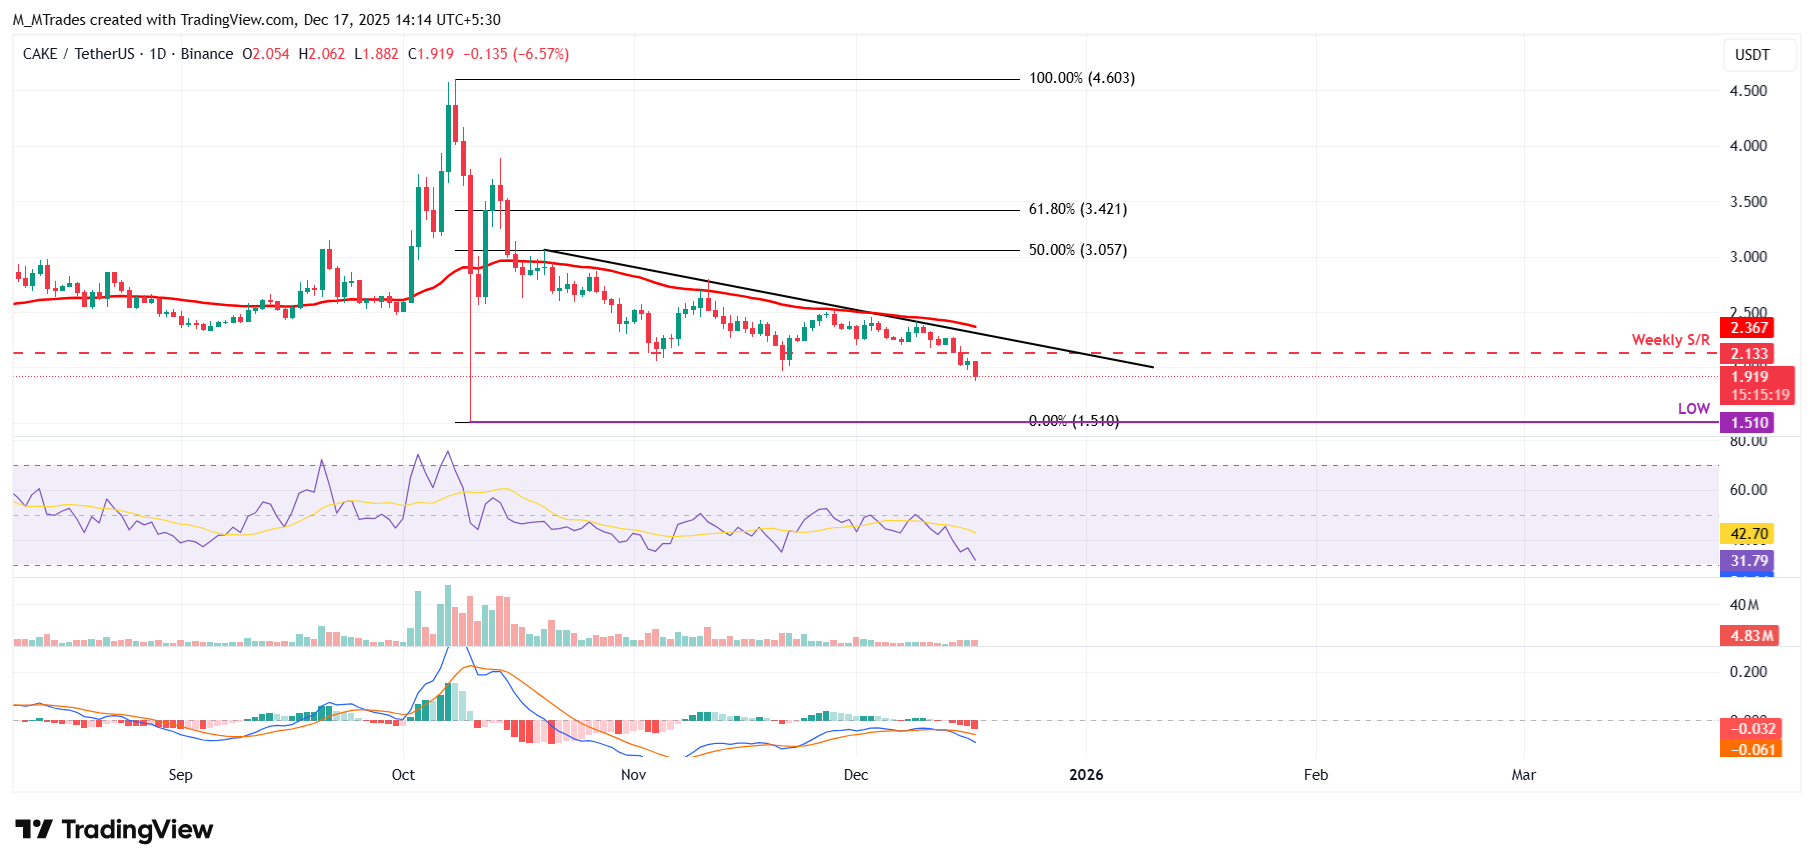
On the other hand, if CAKE recovers, it could extend the advance toward the weekly resistance at $2.13.
Author

Manish Chhetri
FXStreet
Manish Chhetri is a crypto specialist with over four years of experience in the cryptocurrency industry.


