Pepe Price Forecast: PEPE eyes for 20% crash
- Pepe’s price dips on Monday after correcting more than 12% the previous week.
- PEPE’s long-to-short ratio trades below one, indicating more traders are betting for the frog-based meme coin to fall.
- The technical outlook suggests further correction as momentum indicators show signs of weakness.

Pepe (PEPE) continues its decline, trading around $0.000012 and dipping nearly 10% at the time of writing on Monday after correcting more than 12% the previous week. PEPE’s long-to-short ratio trades below one, indicating more traders are betting on the frog-based meme coin to fall. Moreover, the technical outlook suggests a further correction as momentum indicators show weakness, projecting a 20% crash ahead.
Pepe bears aim for 20% crash ahead
Pepe price faced rejection around a descending trendline (drawn by connecting multiple highs since early December) on January 18 and declined over 30% until Sunday, closing below its 200-day Exponential Moving Average at $0.000014. At the time of writing on Monday, it continues to edge down around $0.000012.
If PEPE continues its correction and closes below $0.000013 on a daily basis, it could extend the decline by nearly 20% from current levels and retest its November 8 low of $0.000010.
The Relative Strength Index (RSI) on the daily chart reads 31 and points downwards, indicating strong bearish momentum not yet in oversold conditions, leaving more room to extend the decline.
The Moving Average Convergence Divergence (MACD) indicator also shows a bearish crossover, suggesting a sell signal. Rising red histogram bars below the neutral line zero suggest that the Pepe price could continue its downward momentum.
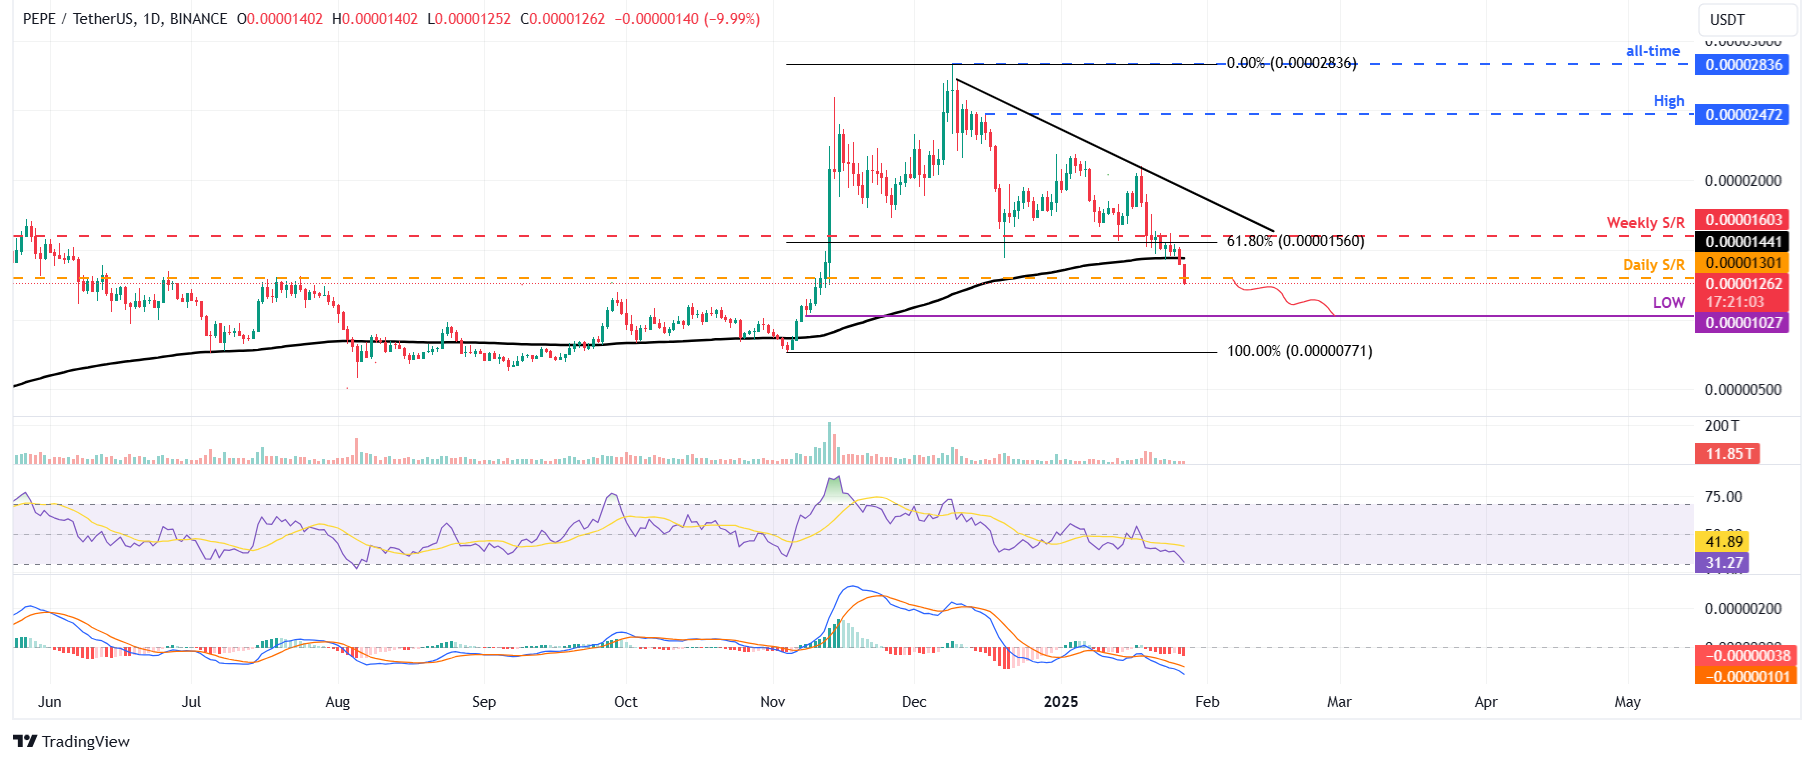
PEPE/USDT daily chart
Another bearish sign is Coinglass’s Pepe long-to-short ratio, which reads 0.72, the lowest level over a month. This ratio below one reflects bearish sentiment in the markets as more traders are betting for the frog-based memecoin to fall.
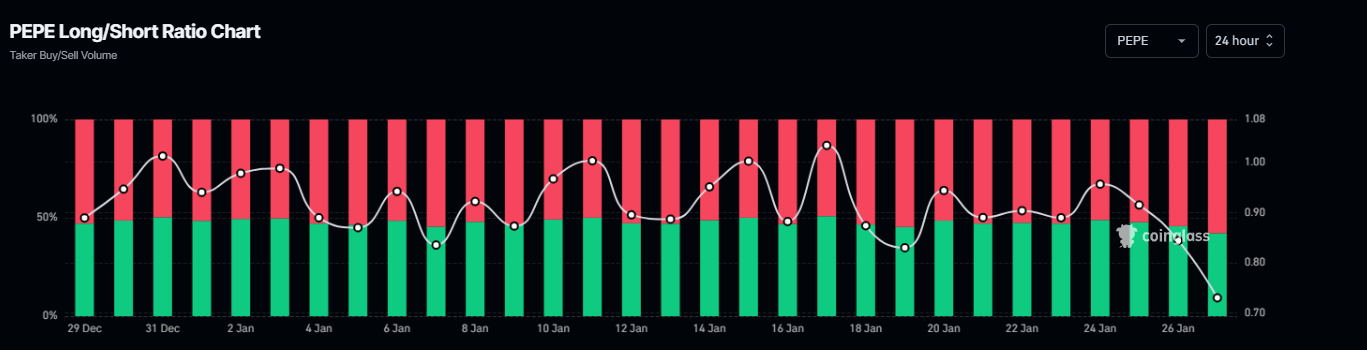
PEPE long-to-short ratio chart. Source: Coinglass
Author

Manish Chhetri
FXStreet
Manish Chhetri is a crypto specialist with over four years of experience in the cryptocurrency industry.


