Optimism price emerges as the quickest Ethereum L2 to recover as demand rises by 150%
- Optimism price could be seen trading at $1.53, recovering by nearly 12%, inching closer to the $1.66 resistance level.
- Over the week, the demand for the altcoin has risen, with OP witnessing a 150% rise in network growth.
- The altcoin has the support of its investors, who held on even in such turbulent times to increase the supply held by long-term holders this month by 25%.

Optimism price made its way back up rather quickly; however, it still has a long way to go before it can completely recover all its losses. Interestingly, the altcoin is finding support from its investors at a time when most of the other altcoins are losing the same.
Optimism price recovery will likely continue
Optimism price could be seen trading at $1.52 at the time of writing, attempting to breach the 50- and 100-day Exponential Moving Average (EMA). In the last three days, the layer-2 blockchain’s native token has managed to rise by close to 12% after bouncing off the support line at $1.37.

OP/USD 1-day chart
This resulted in OP becoming the best-performing L2 token, which consequently led to a spike in the token’s demand. The adoption rate noted a spike, shooting up from 18% to 45% in the span of a day and noting a 150% rise. The adoption rate is akin to network growth, with the exception of the latter measuring the formation of new addresses while the former measures their activity.

Optimism adoption rate
The percentage of new addresses making their first transaction provides insight into the new addresses’ sincerity, suggesting whether the investors are bullish or bearish in their sentiment. A high adoption rate is a good sign unless the activity corresponds with high selling, which would then act as a bearish signal for the altcoin.
However, in the case of Optimism, this is a bullish sign since it corresponds with the shift in the supply of OP tokens into the hands of long-term holders. These are investors that have been holding on to their supply for more than a year now.
A higher concentration of long-term holders suggests that investors are more likely to hold on to their assets through a bearish period, which would prevent sharp drawdowns and support quicker recovery. This is the case with Optimism price as well, with more than 82% of the supply sitting in the long-term holders’ wallets.
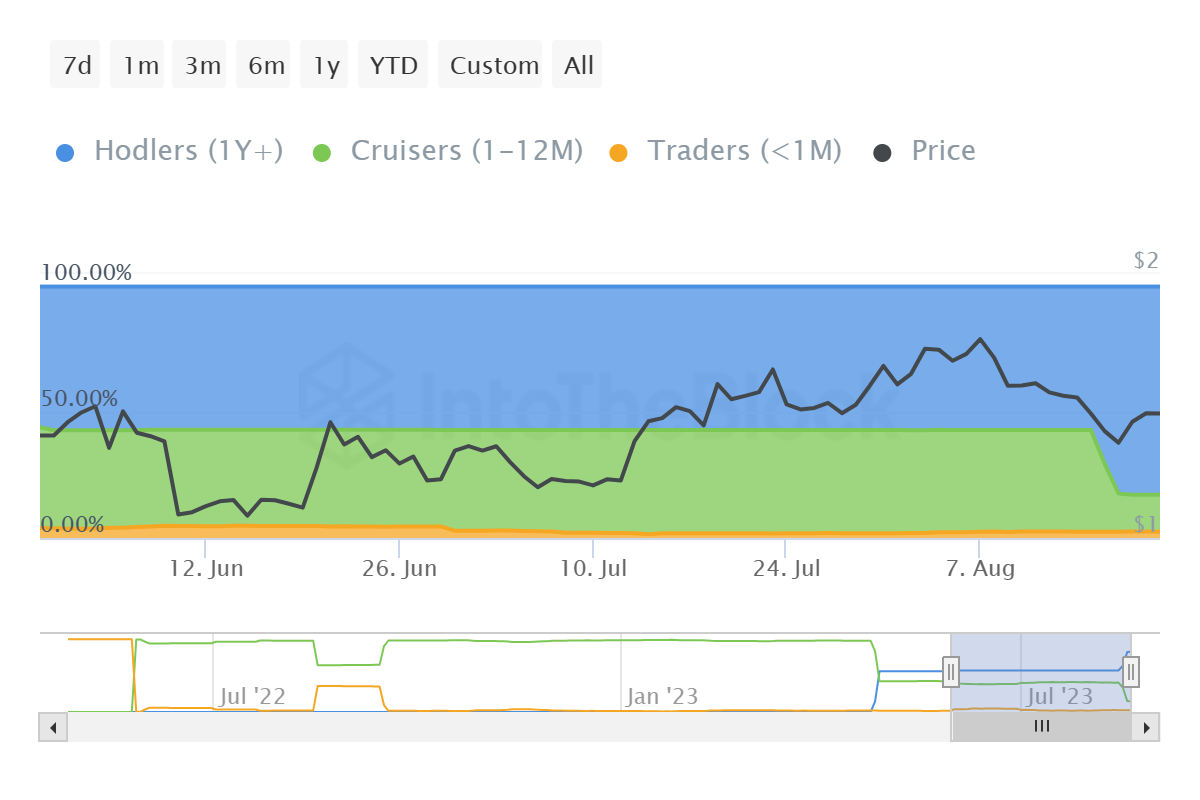
Optimism supply distribution
The Relative Strength Index (RSI) is close to flipping the neutral line at 50.0 into a support level, which would suggest that Optimism price is finding enough support to support further recovery.
Like this article? Help us with some feedback by answering this survey:
Author

Aaryamann Shrivastava
FXStreet
Aaryamann Shrivastava is a Cryptocurrency journalist and market analyst with over 1,000 articles under his name. Graduated with an Honours in Journalism, he has been part of the crypto industry for more than a year now.



