Share:
  • Optimism price shows a clear bullish divergence on the daily chart, forecasting a potential 30% run-up to $1.82.
  • Massive spikes in Whale Transaction Count combined with accumulation patterns suggest OP holders are expecting a bullish future.
  • A daily candlestick close below the $1.34 support level will invalidate the bullish thesis and potentially trigger a correction to $1.06.

Optimism (OP) price shows strength despite the market-wide sell-off on June 5. Additionally, the technicals and on-chain metrics both strongly suggest a bullish future for OP holders. 

Also read: Apple staying mum on Metaverse at WWDC wipes out Metaverse tokens’ value by 10%

Optimism price ready to break free

Optimism (OP) price slid 14% on June 5 but soon recovered and produced a daily candlestick close above $1.34. This move that collected the sell-stop liquidity showed an impressive recovery, which is the first sign of willing OP buyers in the market. 

Additionally, the Relative Strength Index (RSI) and the Awesome Oscillator (AO) indicators display higher lows, indicating rising bullish momentum for Optimism price. Combining the indicators’ rising momentum with OP, which has produced lower lows, reveals a bullish divergence. 

This technical formation is obtained when the underlying asset produces a lower low while the momentum indicators set up higher lows. The non-conformity is termed bullish divergence and often leads to a massive spike in the underlying asset’s price. In this case, it indicates that Optimism price is ready for an explosive move.

A recovery rally above $1.48 is the second sign that bulls are at it. A bounce off the aforementioned level will propel Optimism price to the next target at $1.82. In total, this move would constitute a 31% gain from the current position of $1.39.
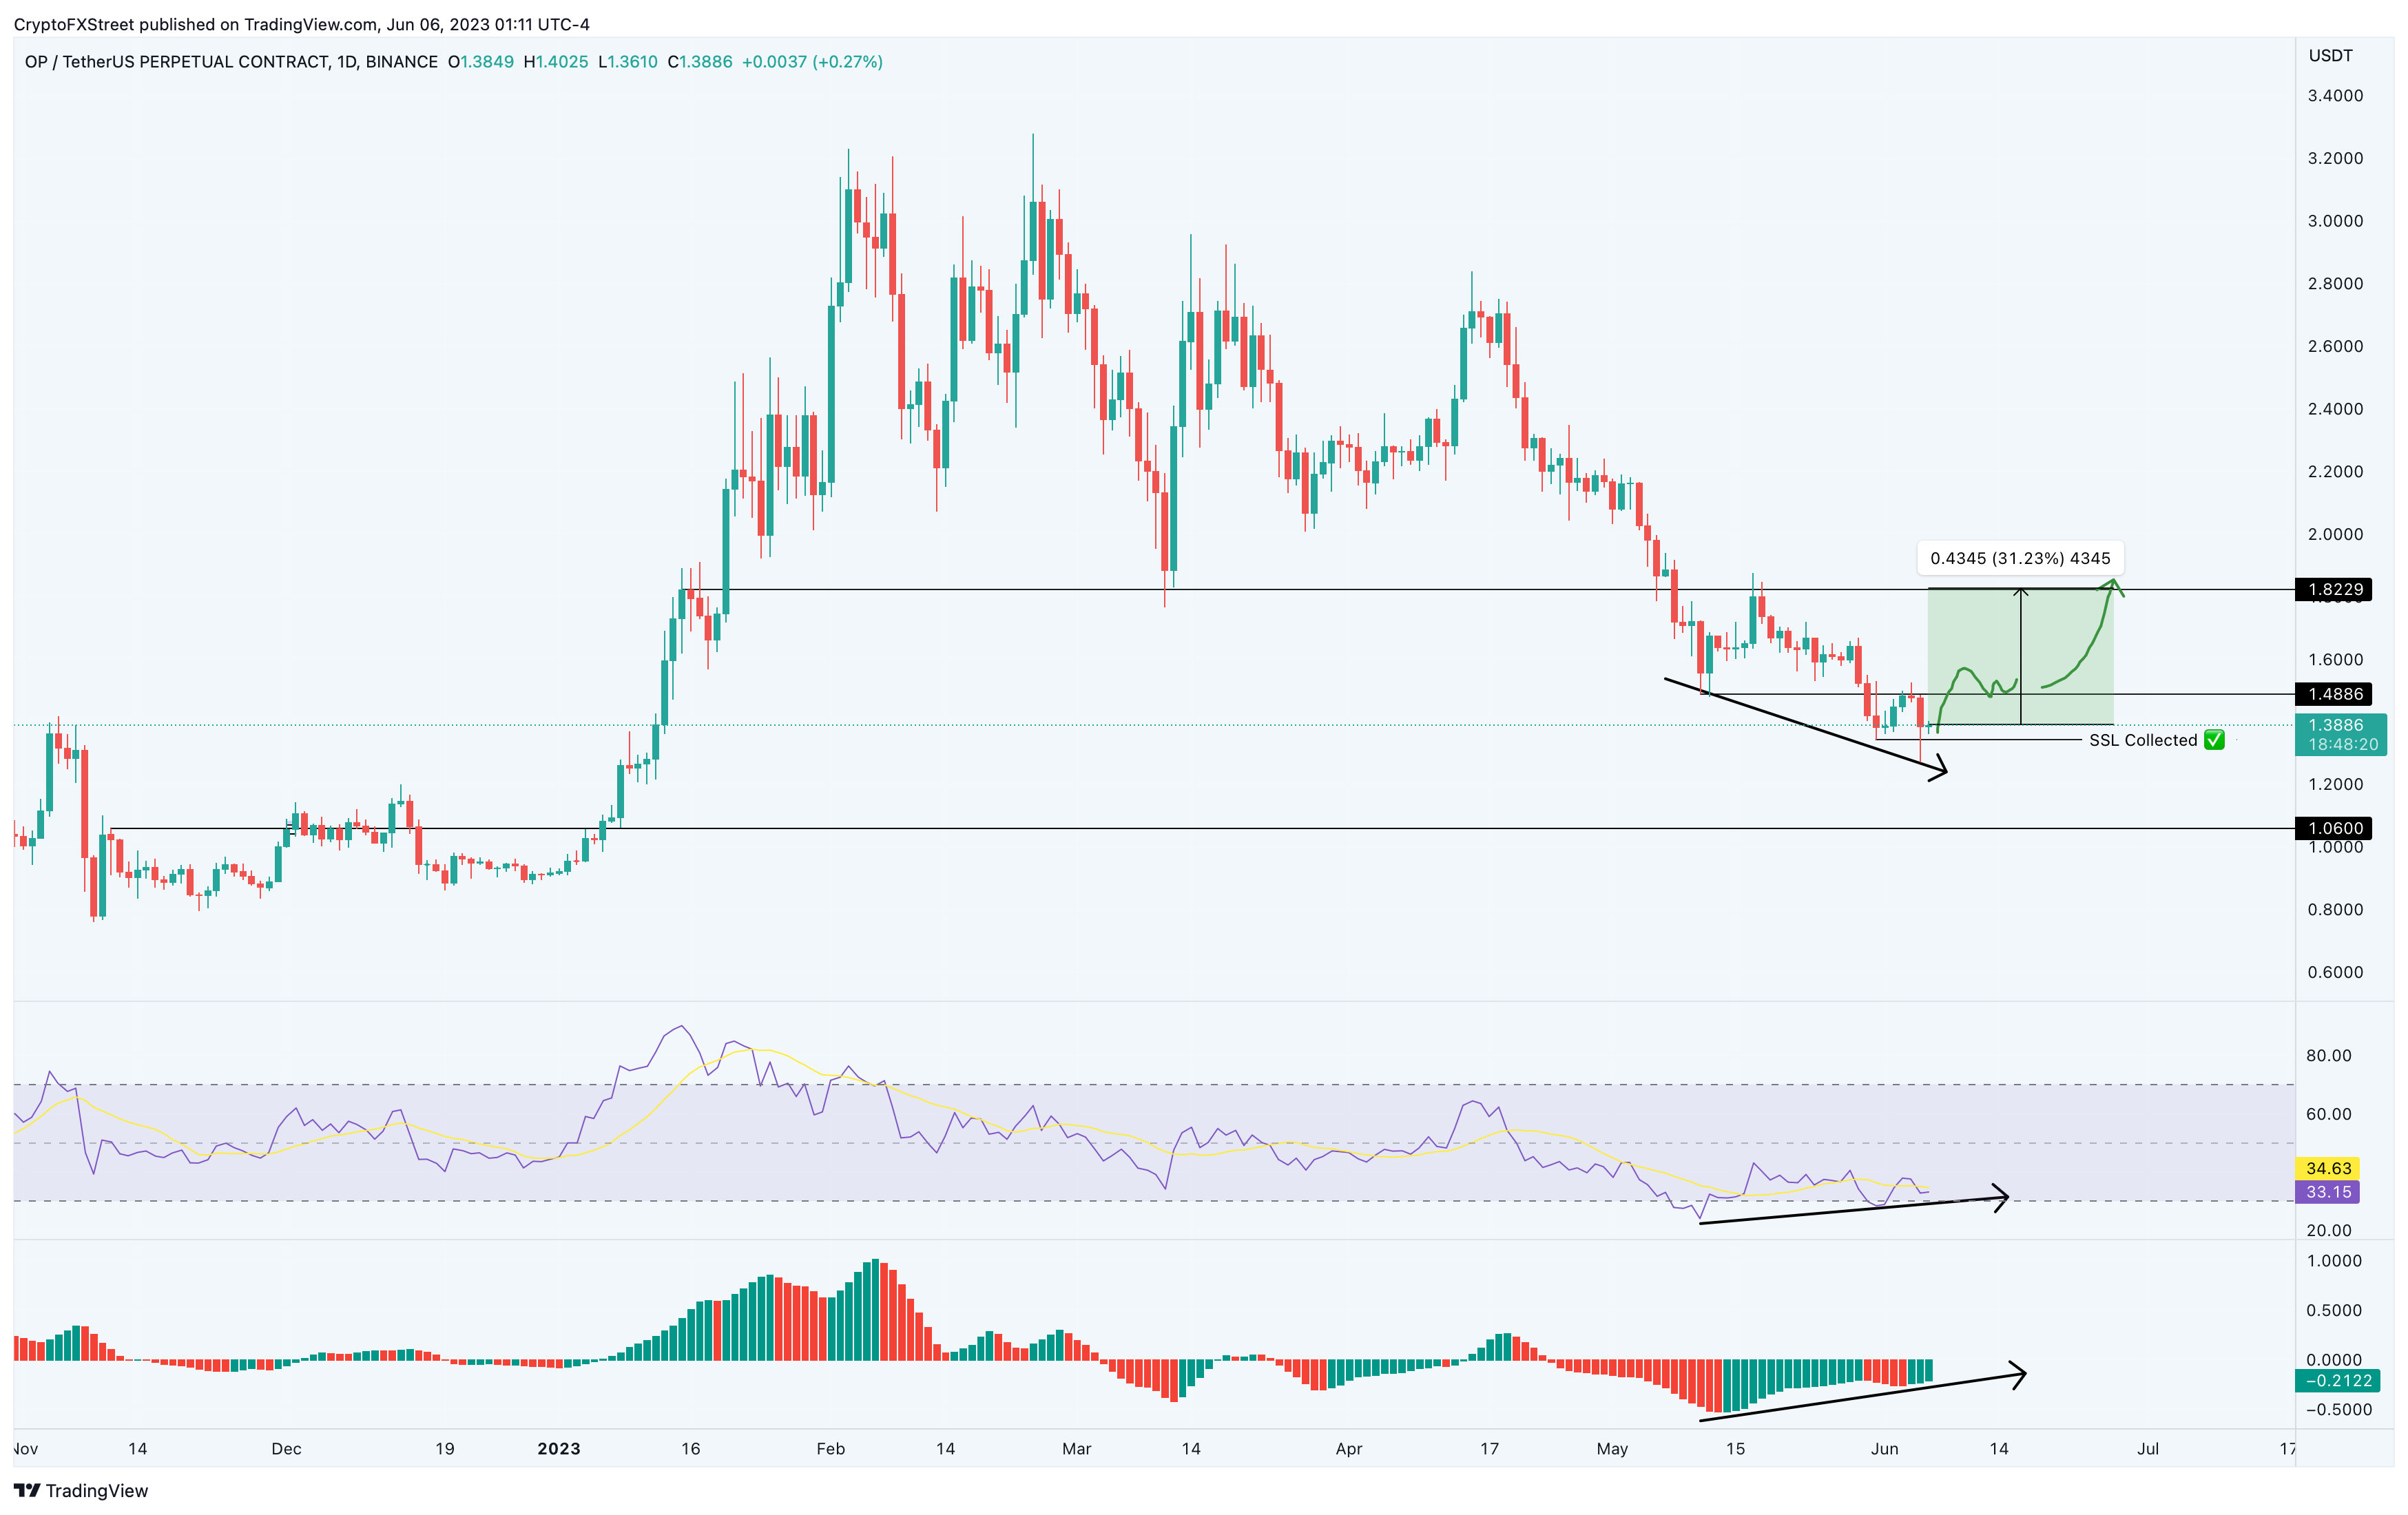
OP/USDT 1-day chart

OP/USDT 1-day chart

On-chain metrics remain optimistic 

One of the most important metric is the Whale Transaction Count. As the name indicates, this index tracks transactions worth more than $100,000. The yellow bars are transactions worth more than $100,000 and the blue bars track transactions worth over $1 million. As seen in the chart, there was a massive spike on May 31 and June 1 after Optimism price dropped 24%. Clearly, this index can be interpreted as whales buying the dip.

OP Whale Transaction Count chart

OP Whale Transaction Count chart

Furthermore, the Supply Distribution chart shows that whales holding 100,000 to 1 million OP tokens have been on a buying spree since May 14. Their number has increased from 21 to 69, denoting a 228% spike.

Similarly, addresses holding 100,000 to 1 million OP tokens have jumped from 54 on May 30 to 78 as of June 6. These patterns suggest that they are expecting a bullish future for Optimism price.

OP Supply Distribution chart

OP Supply Distribution chart

While all signs point to a bullish future for Optimism (OP) price, investors need to be cautious due to the delicate nature of the lawsuit brought forward by the US Securities and Exchange Commission (SEC) against Binance. The initial reaction caused $311 million in liquidations, and the after-effects of the same could continue to pressure the Bitcoin price lower. 

In such a case, a daily candlestick close below the $1.34 support level will create a lower low and invalidate the bullish thesis and potentially trigger a correction to $1.06.


Information on these pages contains forward-looking statements that involve risks and uncertainties. Markets and instruments profiled on this page are for informational purposes only and should not in any way come across as a recommendation to buy or sell in these assets. You should do your own thorough research before making any investment decisions. FXStreet does not in any way guarantee that this information is free from mistakes, errors, or material misstatements. It also does not guarantee that this information is of a timely nature. Investing in Open Markets involves a great deal of risk, including the loss of all or a portion of your investment, as well as emotional distress. All risks, losses and costs associated with investing, including total loss of principal, are your responsibility. The views and opinions expressed in this article are those of the authors and do not necessarily reflect the official policy or position of FXStreet nor its advertisers. The author will not be held responsible for information that is found at the end of links posted on this page.

If not otherwise explicitly mentioned in the body of the article, at the time of writing, the author has no position in any stock mentioned in this article and no business relationship with any company mentioned. The author has not received compensation for writing this article, other than from FXStreet.

FXStreet and the author do not provide personalized recommendations. The author makes no representations as to the accuracy, completeness, or suitability of this information. FXStreet and the author will not be liable for any errors, omissions or any losses, injuries or damages arising from this information and its display or use. Errors and omissions excepted.

The author and FXStreet are not registered investment advisors and nothing in this article is intended to be investment advice.

Join Telegram

Follow us on Telegram

Stay updated of all the news

Join Telegram

Recommended content


Follow us on Telegram

Stay updated of all the news

Join Telegram

Recommended Content

Editors’ Picks

Shiba Inu price stagnancy brings investors’ losses to a 28-month high

Shiba Inu price stagnancy brings investors’ losses to a 28-month high

Shiba Inu has been rather dormant these past four weeks, which is bearing a negative impact on the investors. The meme coin market has been struggling to make headlines as the lack of increase in altcoin’s market value has left investors in peril, which is now driving them to pull back and wait until SHIB starts rising again.

More Shiba News

LDO sees lowest cumulative volume in ten months as Lido DAO price struggles to breach key barrier

LDO sees lowest cumulative volume in ten months as Lido DAO price struggles to breach key barrier

Lido DAO price is up over the past day as the market shifted its stance despite the SEC announcing a delay in the spot Bitcoin ETF applications of BlackRock among other applicants. However, this one-day rise is not enough for the likes of LDO that have been failing in recovering for a few weeks now.

More Lido DAO News

THORChain leaps 12% with soaring open interest as RUNE targets a peak of its current range

THORChain leaps 12% with soaring open interest as RUNE targets a peak of its current range

THORChain is testing a crucial multi-month obstacle after a remarkable climb. The move has completed the altcoin’s recovery rally following the 15% fall of September 27.  RUNE has outperformed the broader market, with Bitcoin and Ethereum recording only up to 3% in daily gains.

More Rune News

Chainlink and Australia’s ANZ Bank issue AUD-stablecoin to successfully test interoperability

Chainlink and Australia’s ANZ Bank issue AUD-stablecoin to successfully test interoperability

Chainlink put itself on the map with the help of its real-time data-feeding Oracles and is now in the spotlight for its interoperability protocol. Through this protocol, the blockchain project intends to not only connect two or five chains but also create the world’s largest liquidity layer, starting with Australia’s second-largest bank.

More Chainlink News

Bitcoin: BTC downside likely after 20-week EMA culls bulls

Bitcoin: BTC downside likely after 20-week EMA culls bulls

Bitcoin (BTC) bearish price fractal, as discussed in a previous article, is underway, but the lack of volatility is causing ambiguity and doubt. Regardless, BTC might see a bit of an upside before the long-term bearish scenario plays out.

Read full analysis

BTC

ETH

XRP