Optimism could extend losses by nearly 9% amidst bearish on-chain metrics
- Optimism active addresses close to four month peak, OP traders reduce their holdings at unrealized losses.
- OP holders have realized over $7 million in losses in July, per Santiment data.
- OP could extend losses by 8.5% and collect liquidity at November 9 low of $1.379.

Optimism (OP), an Ethereum scaling token is poised for nearly 9% correction as on-chain metrics turn bearish. While the number of active addresses hit a near four month peak, per Santiment data, OP traders are realizing losses.
OP trades at $1.507 at the time of writing, early on Thursday.
Optimism on-chain metrics turn bearish
Santiment data shows that active addresses climbed to 21,661 on July 3, up from 10,257 a day before. Active addresses is a metric that is used to identify the relevance of an asset and its popularity among market participants.
The rise in Optimism active addresses shows rising on-chain activity. However, when combined with Network Realized Profit/Loss, a metric used to identify the net profit/loss of all traders on a given day.
OP traders have realized over $7 million in losses in July, per Santiment data.
Typically, OP traders shedding their asset holdings, combined with rising address activity is bearish for the scaling token. Unless OP traders capitulate, that is, distribute their token holdings at a sizable loss for a prolonged period of time, it is bearish for OP price.
 [23.44.47, 04 Jul, 2024]-638557166478810271.png)
Active addresses, NPL and OP price
OP could extend losses by 8.5%
OP trades at $1.509 at the time of writing. The scaling token could extend its losses by another 8.5% and drop to the Fair Value Gap at $1.379, as seen on the OP/USDT daily chart. The momentum indicator, Moving Average Convergence Divergence (MACD) supports the bearish thesis with MACD line crossing under the signal line, as seen on July 4, Thursday.
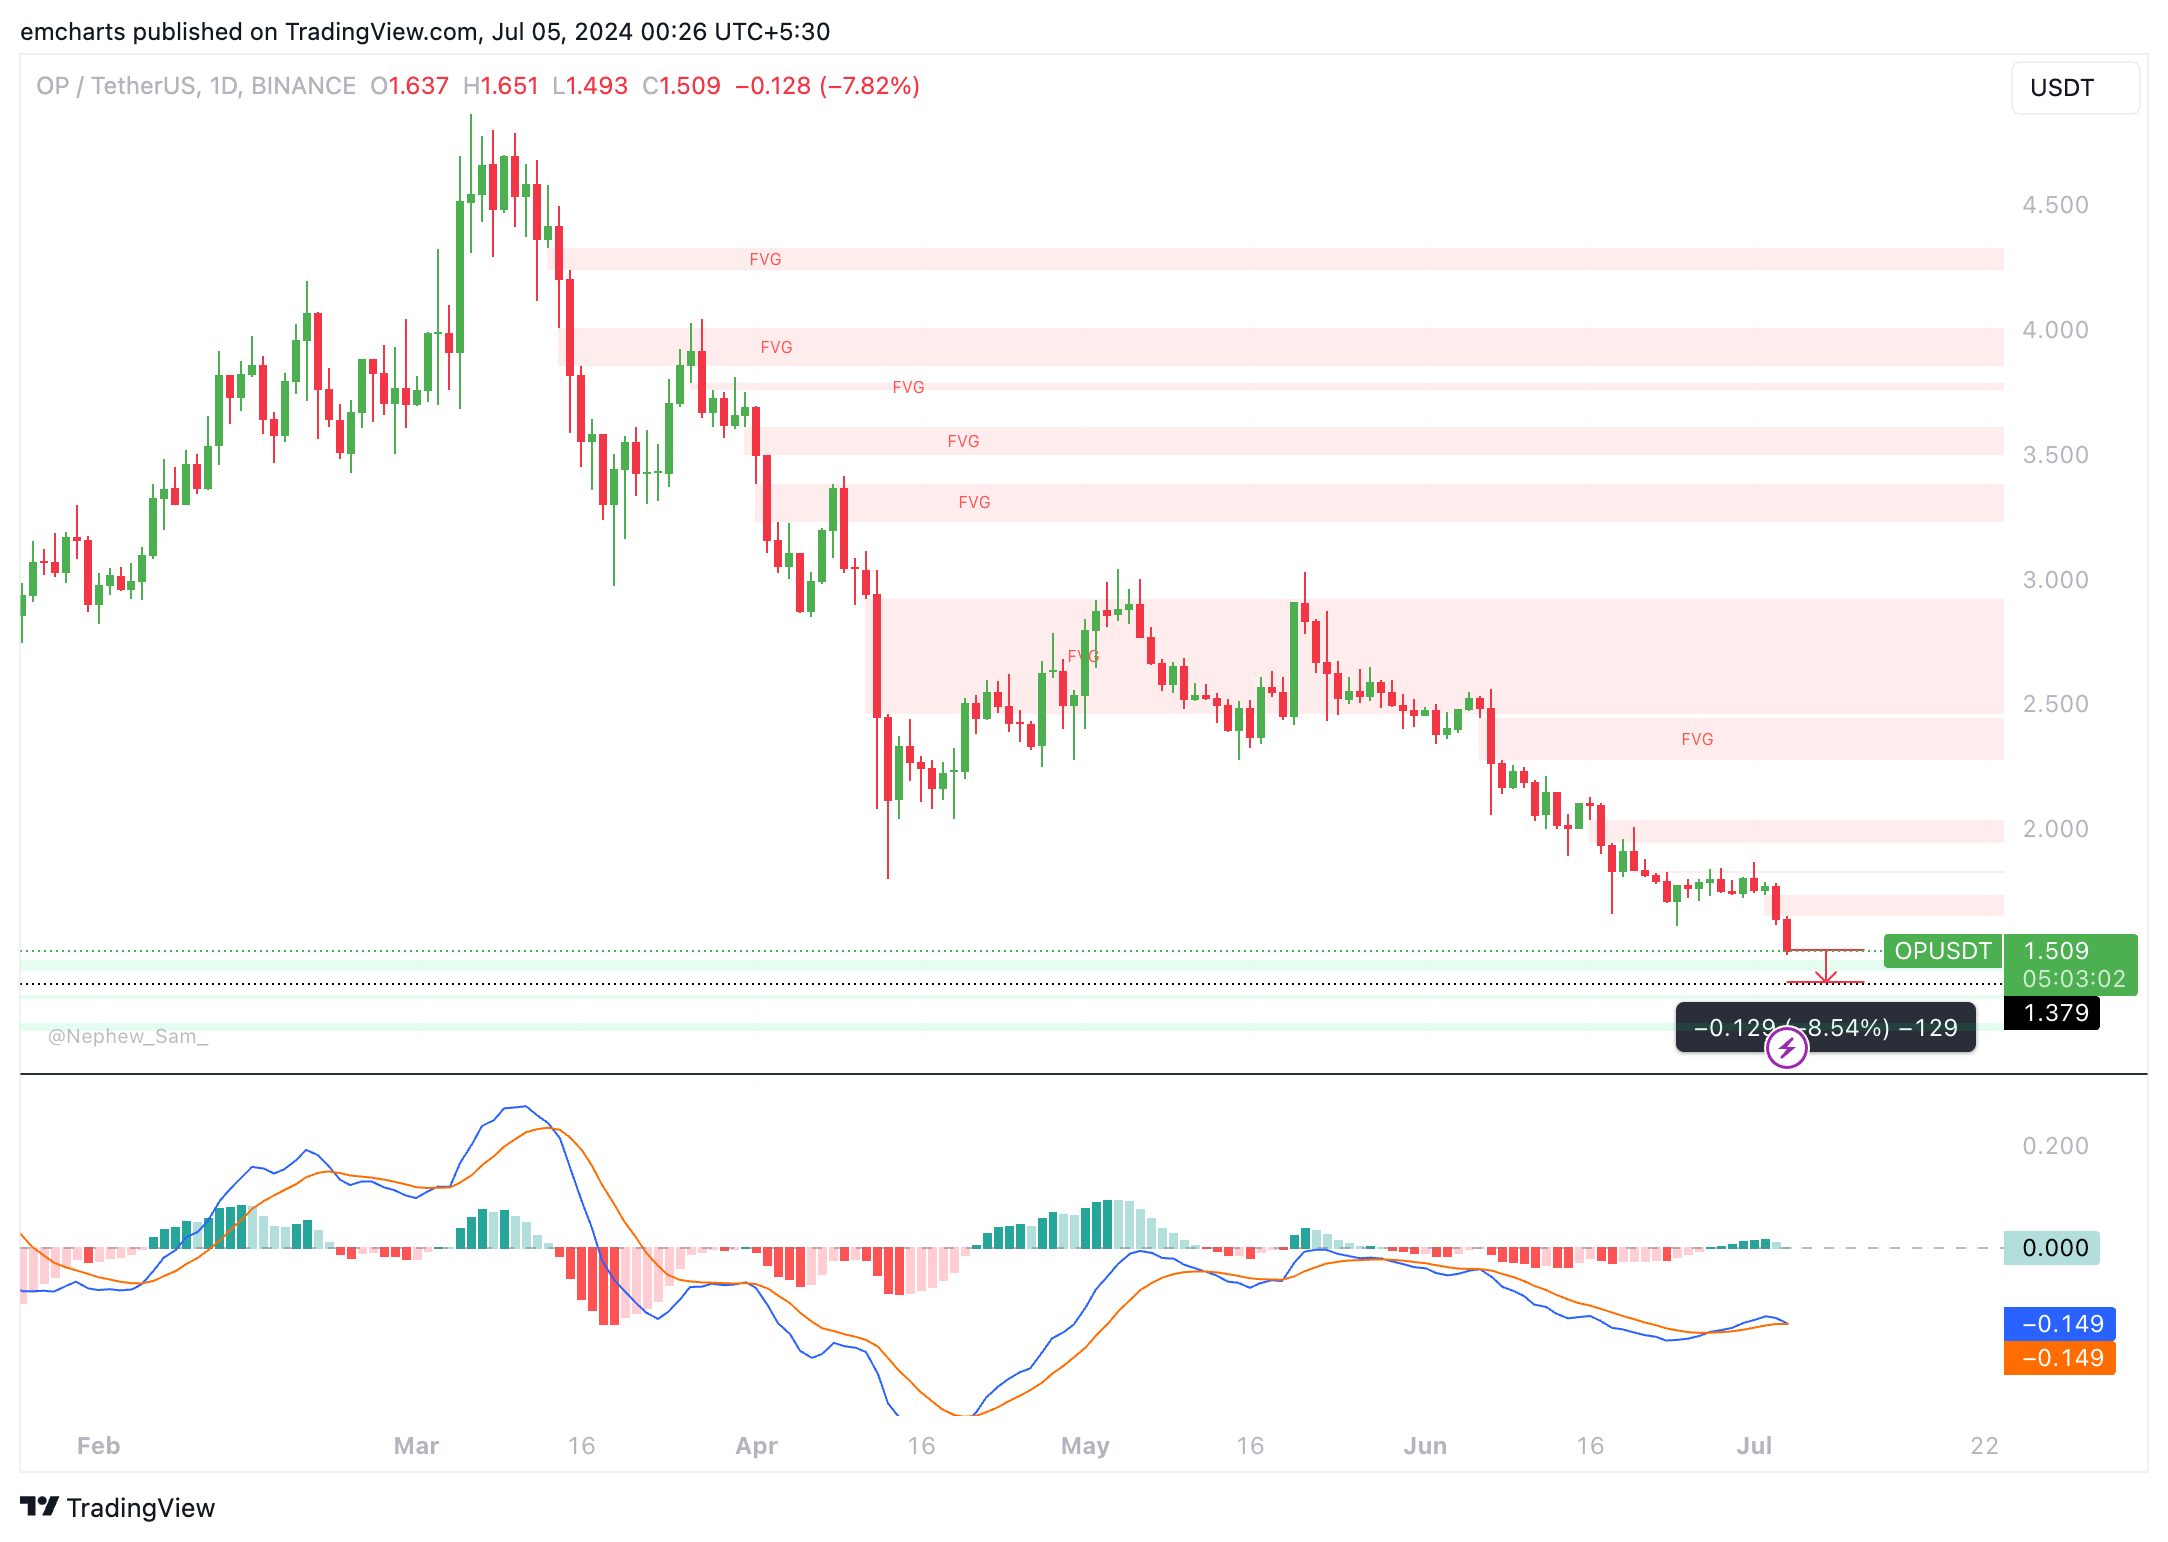
OP/USDT daily chart
A daily candlestick close above $1.739 could invalidate the bearish thesis and push OP closer to resistance at June 18 peak of $1.945.
Author

Ekta Mourya
FXStreet
Ekta Mourya has extensive experience in fundamental and on-chain analysis, particularly focused on impact of macroeconomics and central bank policies on cryptocurrencies.



