Ontology Price Analysis: ONT utility expands setting the stage for a 230% bull rally
- Ontology price is contained inside a symmetrical triangle pattern since 2019.
- The Ontology Foundation announced several positive news for ONT.
- The growth of ONT in January 2021 can lead the digital asset towards new highs.
Ontology price has been trading inside a long-term symmetrical triangle and it’s ready for a significant breakout. There are several announcements in favor of ONT which can push the digital asset towards $2.3.
Ontology Foundation gets green light for automobile app
The Ontology Foundation joined forces with Daimler Mobility AG to create the Welcome Home application which intends to provide blockchain solutions to the automotive industry. The app passed the initial screening of Daimler Mobility.
Ontology and Daimler Mobility AG's blockchain factory will develop the world's first blockchain-based mobility platform for the automotive and mobility industries on September 24, 2020, called MoveX . Announced collaboration. "Home Welcome (Welcome Home) " is MoveX is the first product of the platform, is a combination of mobility and social networking. Ontology's DeID framework ONT ID provides a highly personalized experience and integrated services while preserving user privacy and data management rights.
On February 1, the Ontology Monthly Report came out for January 2021 and seemed very positive for the digital asset. According to the article, 3,671 new members joined Ontology and the mainnet has reached 112 dapps built on it. These statistics show a significant growth in the usage of ONT that should translate into an increase in price.
Ontology price ready for a 240% rally towards $2.4
On the 3-day chart, Ontology has formed a symmetrical triangle pattern since June 2019 with a height of $1.6 between its highest and lowest points. A breakout above $0.7 will lead Ontology price towards $2.3, which is a 230% rally, calculated by adding the $1.6 difference in height of the pattern to the $0.7 breakout point.
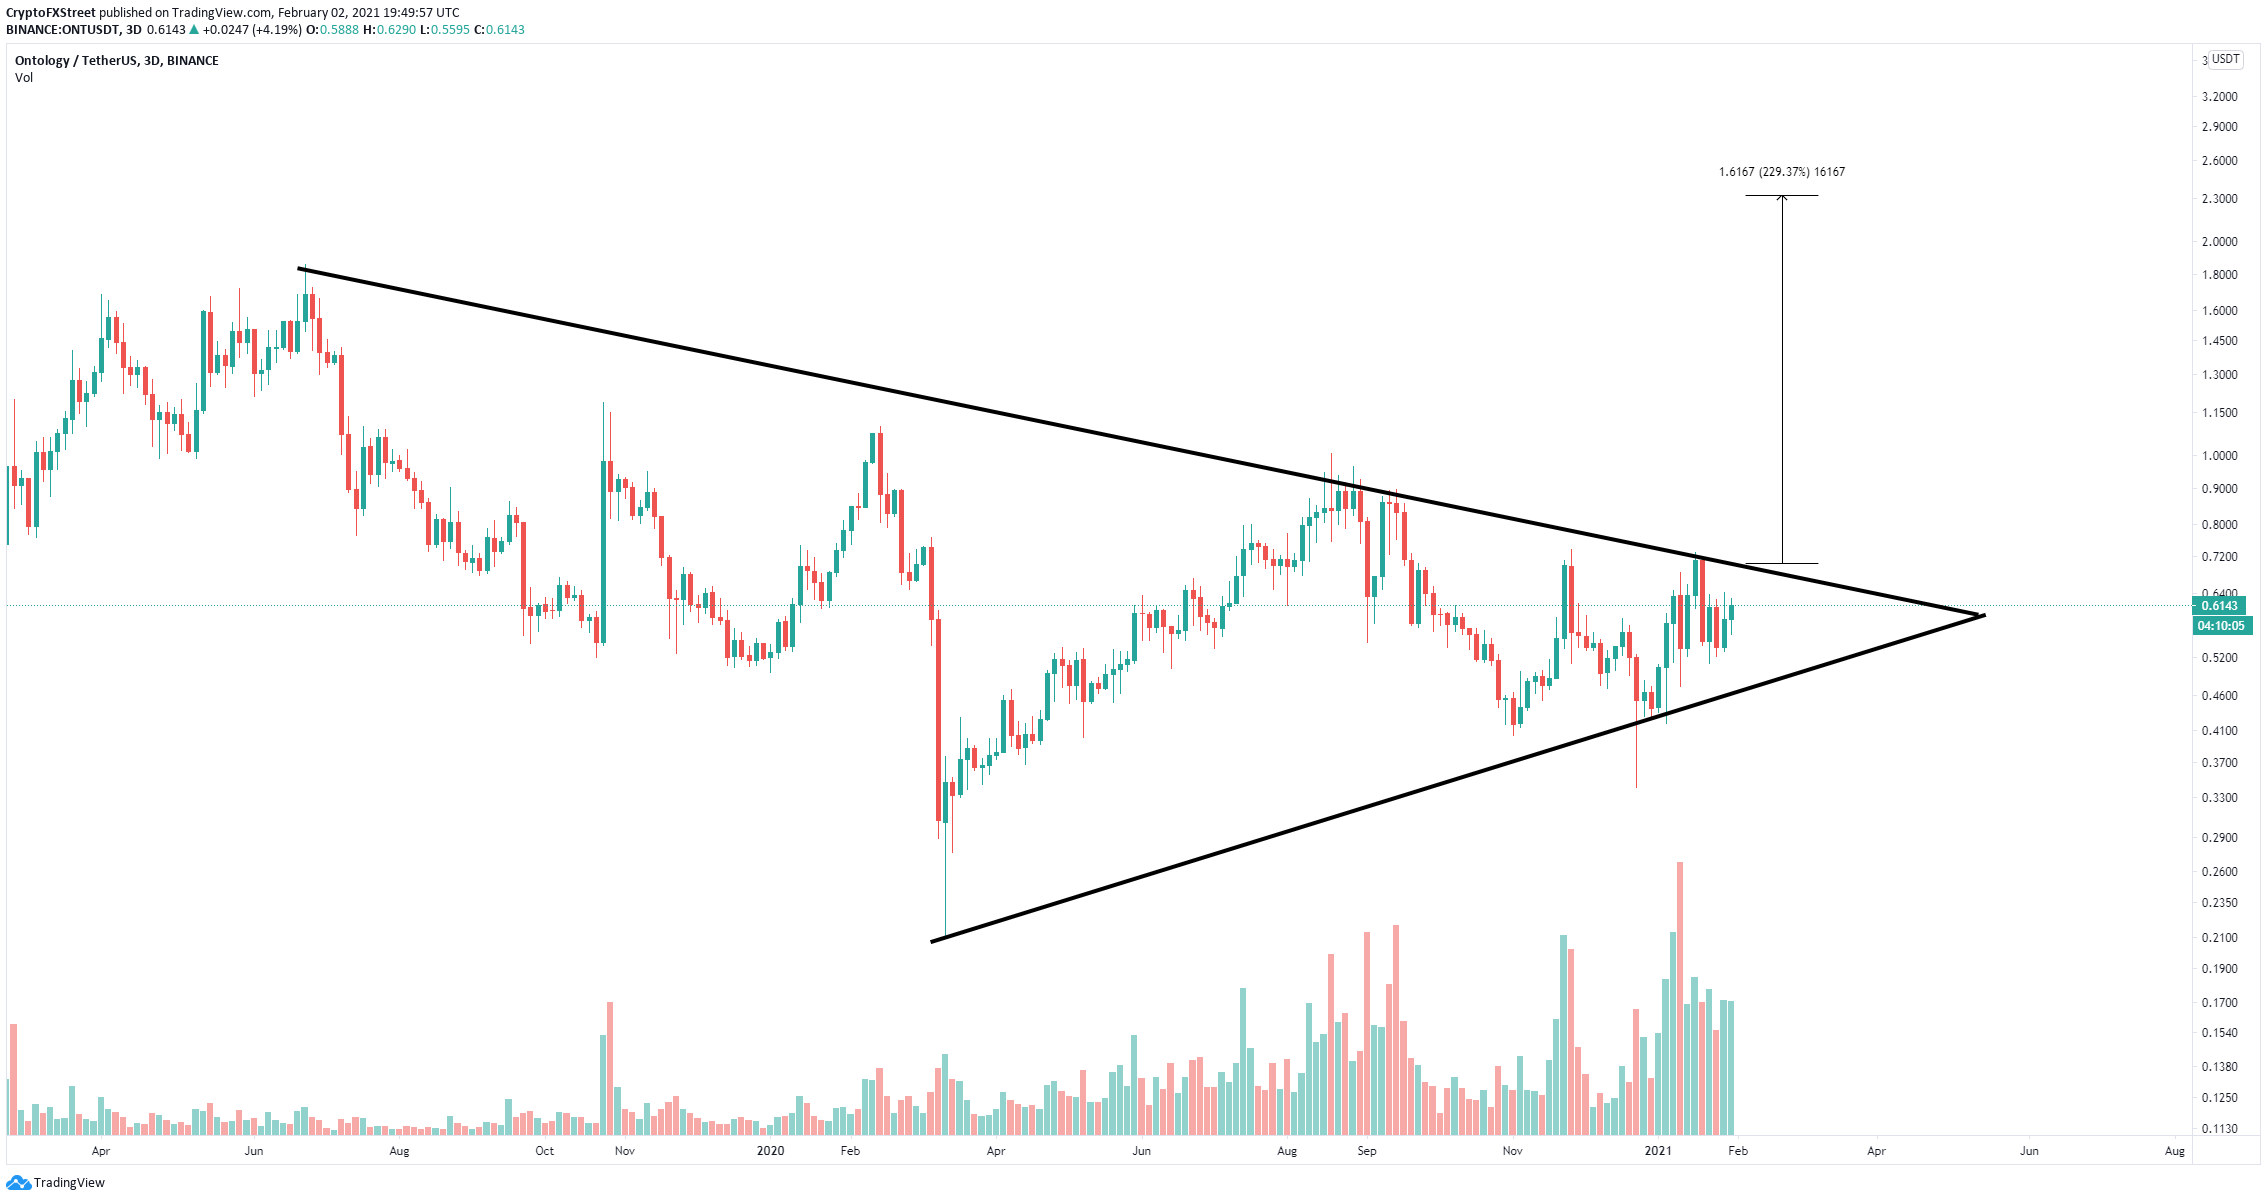
ONT/USD 3-day chart
The In/Out of the Money Around Price (IOMAP) chart shows the strongest barrier is located between $0.65 and $0.67, which coincides with the upper trendline resistance of the symmetrical triangle pattern and gives a lot of credence to the bullish outlook after a breakout above this point.
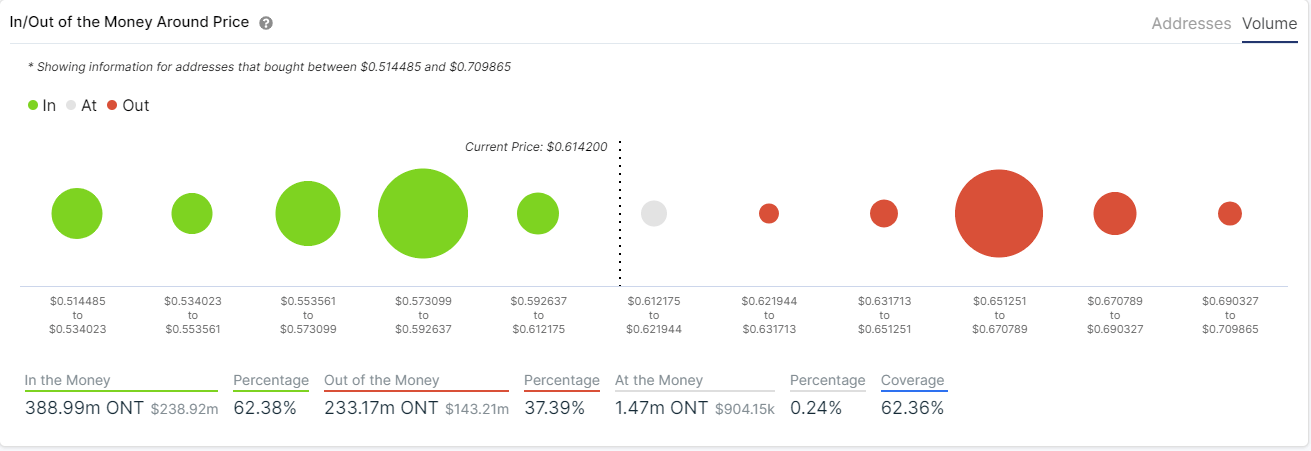
ONT IOMAP chart
On the way down, the IOMAP model indicates that the range between $0.57 and $0.59 with 220 million ONT in volume is the sturdiest support area. Losing this level would drive Ontology price down to $0.5 wich coincides with the lower support trendline of the symmetrical triangle on the 3-day chart.
Author

Lorenzo Stroe
Independent Analyst
Lorenzo is an experienced Technical Analyst and Content Writer who has been working in the cryptocurrency industry since 2012. He also has a passion for trading.


