On-chain metrics spell trouble for Bitcoin, Ethereum, and XRP despite on-going bull rally
- Bitcoin price is close to its all-time high, currently trading at $19,300.
- XRP had a massive 242% colossal rally in the past week.
- Ethereum price is also closely following Bitcoin's step.

The top three cryptocurrencies are seeing massive gains over the past few days. However, some on-chain metrics and technical indicators are showing that a potential pullback might be underway in the short-term.
Bitcoin price aims for the all-time high at $20,000 but could face intense selling pressure
Bitcoin reached a high of $19,418 in the past 24 hours, only a few hundred dollars away from its all-time high. The digital asset looks extremely strong but could be facing a lot of selling pressure as it approaches the critical level.
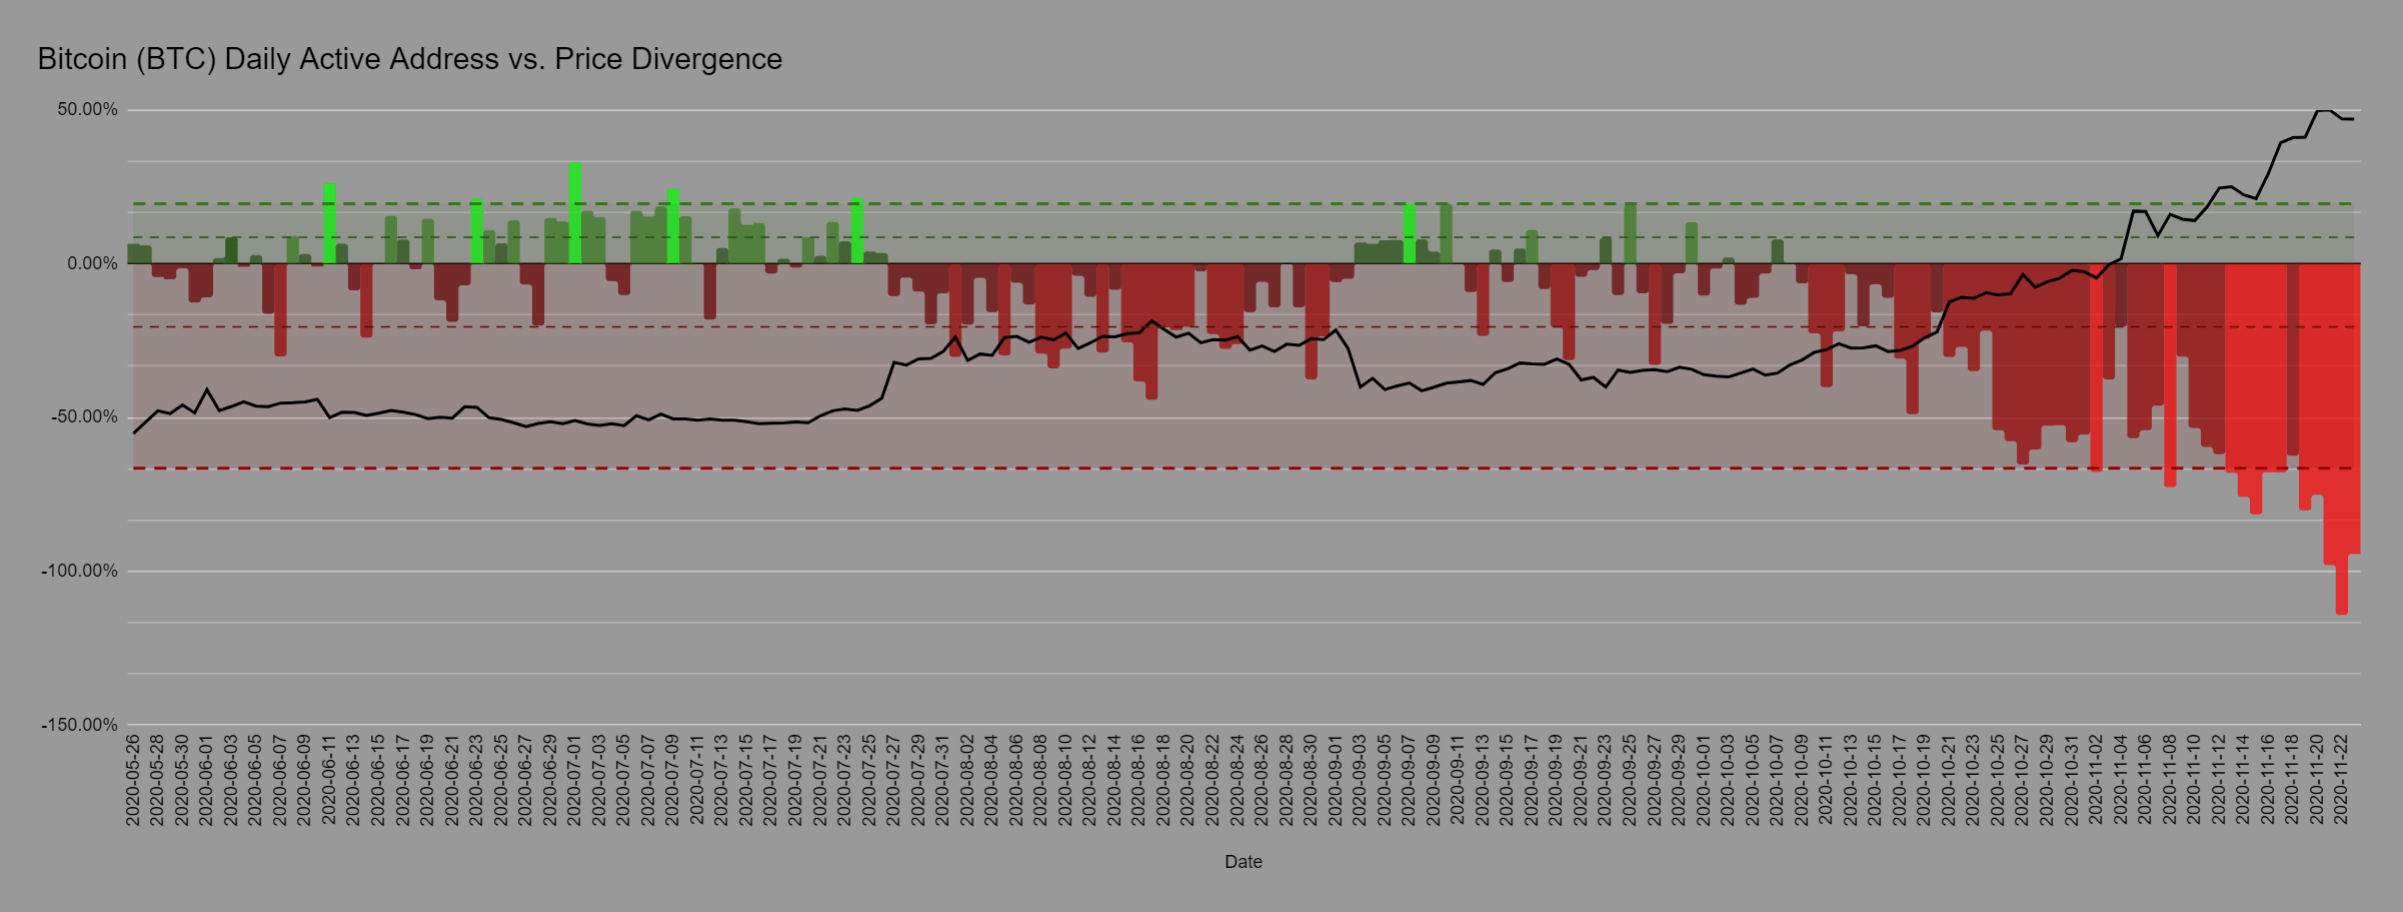
DAA vs. Price Divergence chart
It seems that the DAA divergence chart is showing a lot of red bars, which is usually an indication that an asset is reaching the top. In this case, the metric has more strength because of the lack of new addresses joining the Bitcoin network.
 [21.37.19, 24 Nov, 2020]-637418485527110605.png)
BTC Holders Distribution
It also seems that the number of whales holding between 100 and 1,000 Bitcoin has declined from a peak of 13,953 on November 8 to a current low of 13,787, despite the significant increase in Bitcoin price.
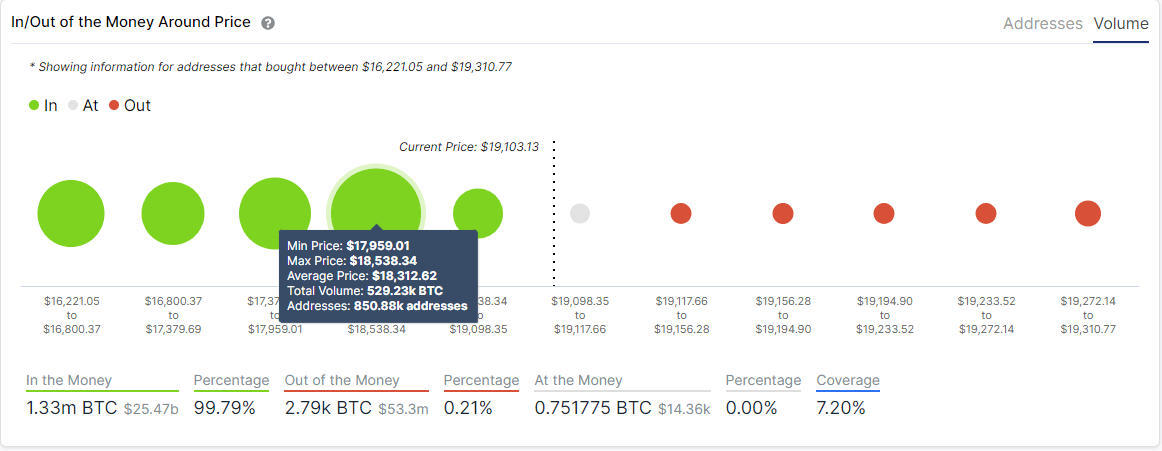
BTC IOMAP chart
This decline would suggest that many investors are taking profits and selling currently, increasing Bitcoin's selling pressure. The In/Out of the Money Around Price chart shows the next significant support level to be at $18,000, which would be the initial bearish price target in the event of a correction.
Ethereum lacks activity inside the network
Eth2 deposit contract received the required 524,288 ETH, and the digital asset spiked above $600 for the first time in two years. However, it seems that the number of new addresses joining the network is not increasing.
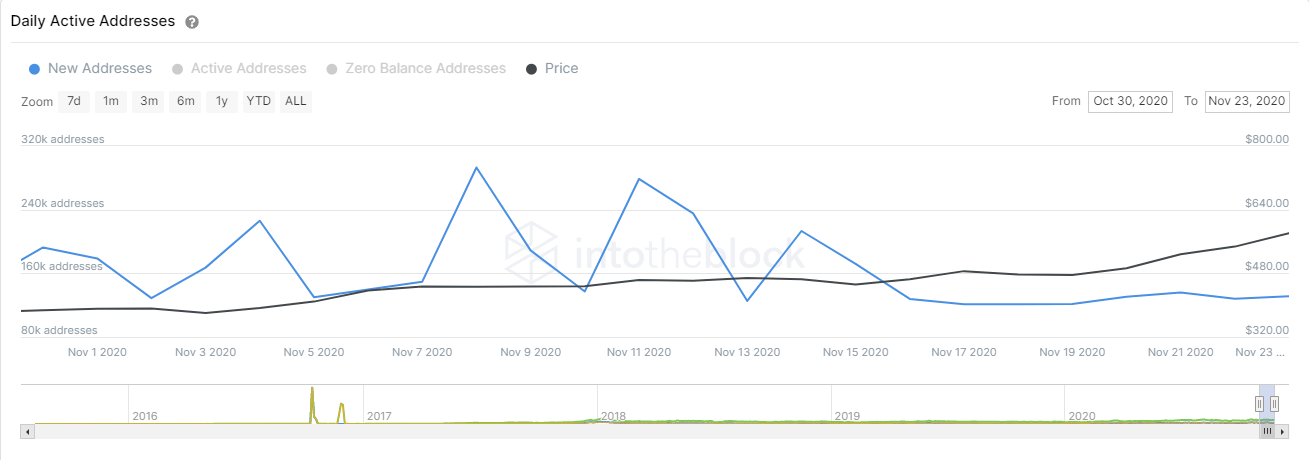
ETH new addresses chart
After two spikes on November 8 and 11, the number of new addresses has declined significantly since November 16, and it's only up by 2.7% in the past week. This metric could suggest that new investors are not yet convinced of the bullishness of Ethereum.
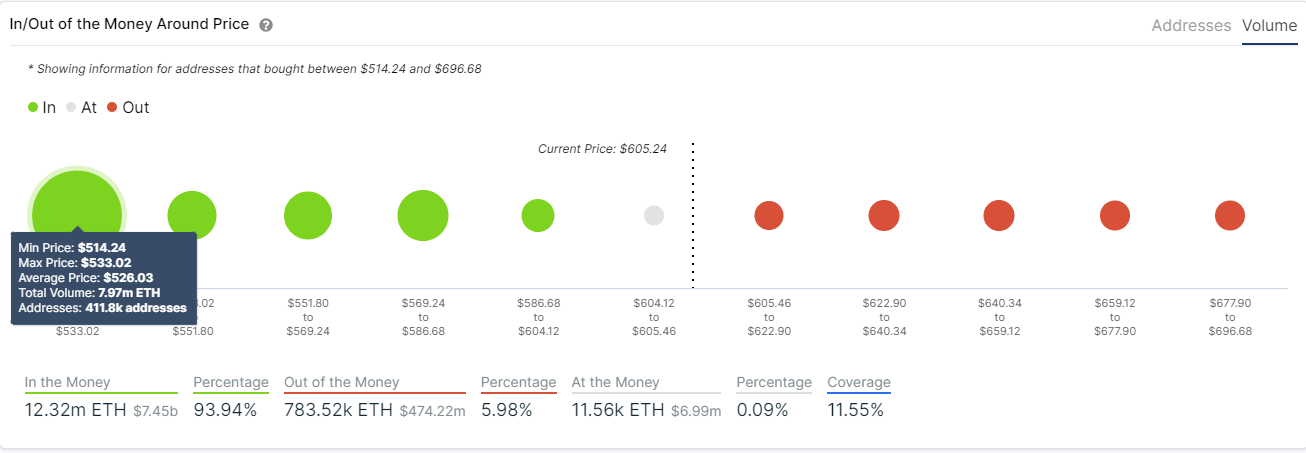
ETH IOMAP chart
The IOMAP chart shows no significant support until the area between $514, and $533, were 411,000 addresses purchased close to 8 million ETH. This would be the nearest bearish price target.
XRP social sentiment might be too optimistic
Although XRP has many on-chain and technical indicators in its favor, one critical metric indicates that a local top might be forming. The weighted social sentiment chart provided by Santiment shows a massive spike in the past three days.
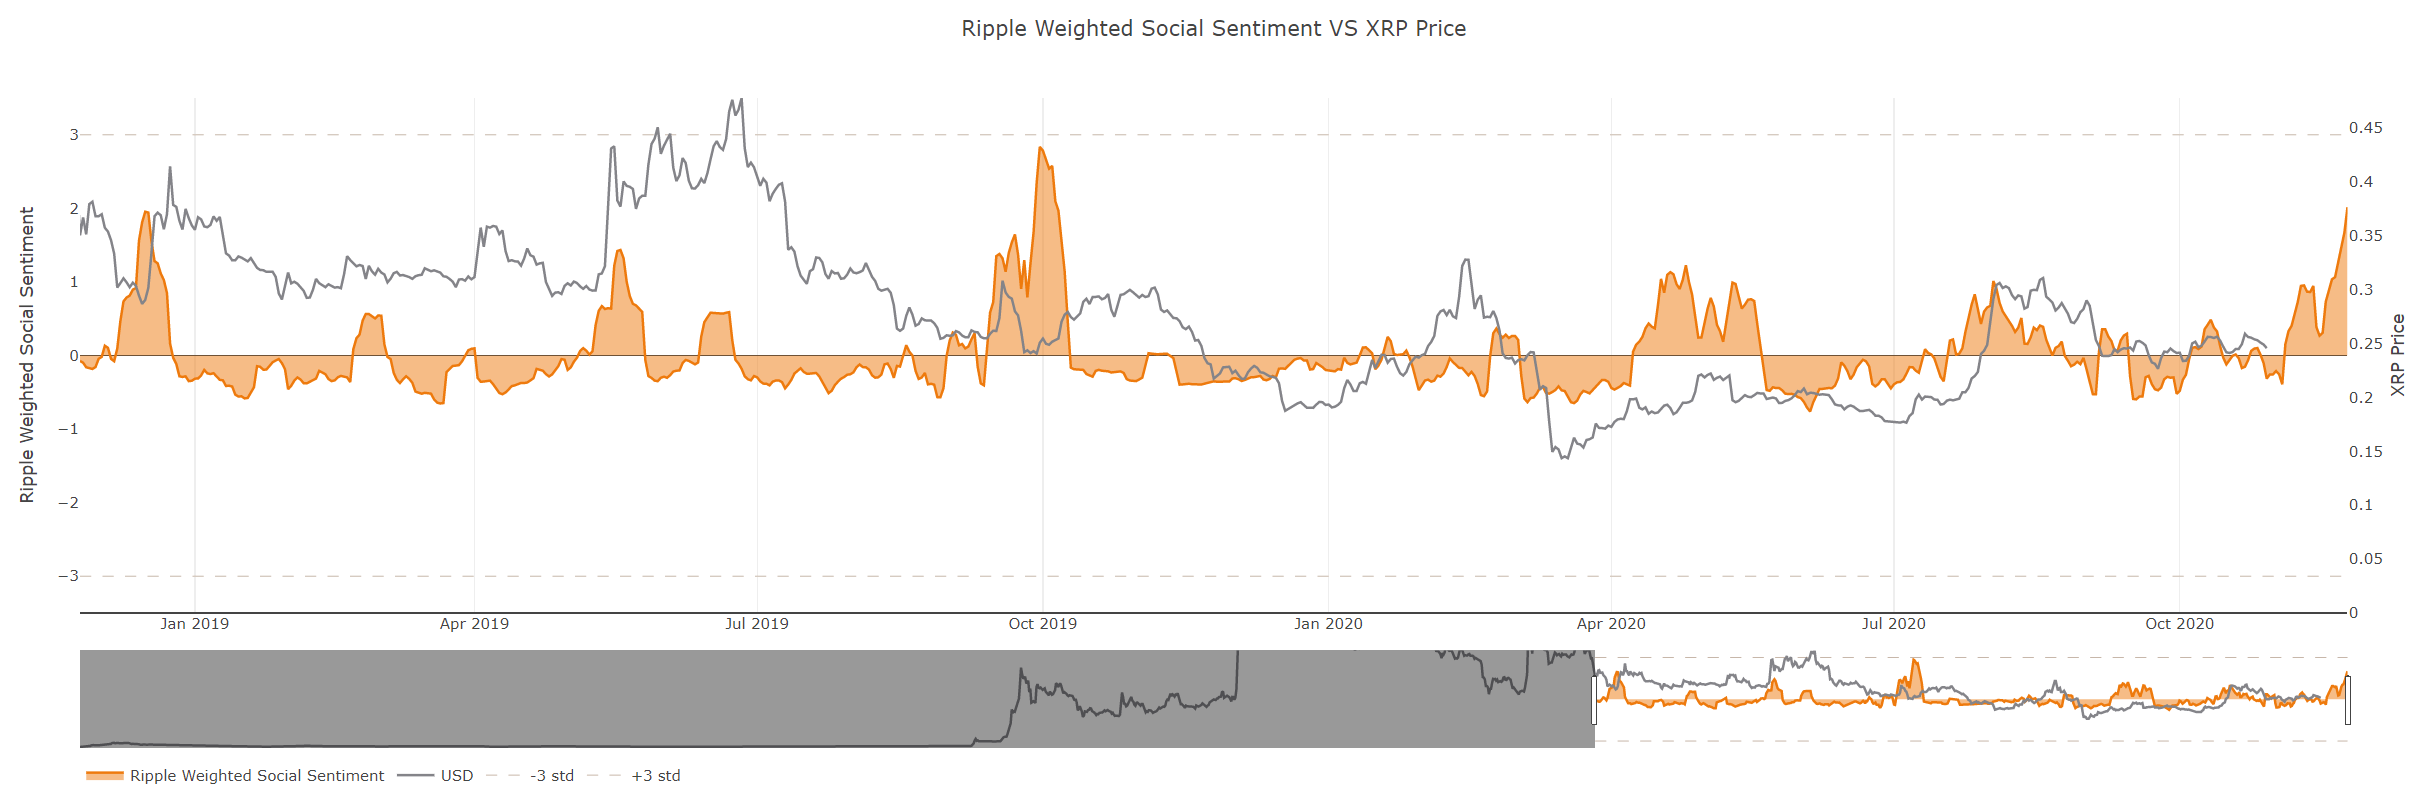
Weighted Social Sentiment chart
The last time XRP saw similar spikes in the positivity of its holders on social media was in October. That last rise was followed by a steep 10% decline in the price of XRP, which indicates that the digital asset could be facing a similar situation now.
Author

Lorenzo Stroe
Independent Analyst
Lorenzo is an experienced Technical Analyst and Content Writer who has been working in the cryptocurrency industry since 2012. He also has a passion for trading.


