|

Monero Price Analysis: XMR/USD bullish streak finally halts after five days

  • During this five-day bullish streak, XMR/USD raised from $61.40 to $74.90.
  • The RSI indicator is looking to fall from the overbought zone.

XMR/USD daily chart

XMR/USD daily chart

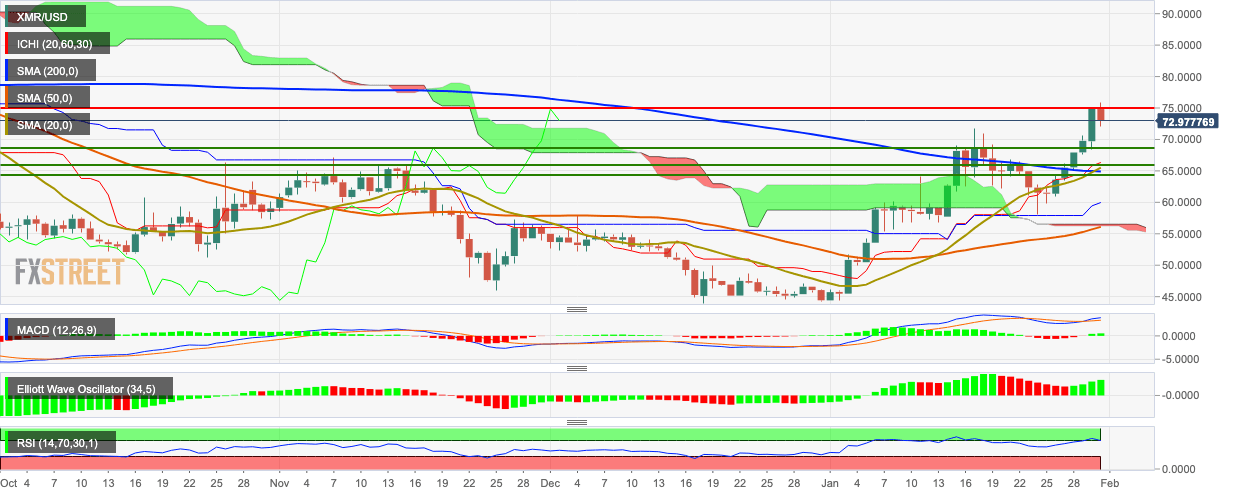
XMR/USD finally ran out of steam after five straight bullish days. The sellers took control in the early hours of Friday and dropped the price to $73.15. This bearish correction was inevitable since the RSI indicator was trending in the overbought zone, showing that the asset was overpriced. It has since dropped to around 70.

The price is hovering above the Ichimoku cloud, SMA 200, SMA 50 and SMA 20. The SMA 20 has crossed over the SMA 200, to chart the golden cross pattern, the Elliott Oscillator has had four straight green sessions, and the MACD indicates bullish momentum. All these indicators tell us that while the market is going through a temporary bearish correction, the overall market sentiment is still bullish.
 

Author

Rajarshi Mitra

Rajarshi Mitra

Independent Analyst

Rajarshi entered the blockchain space in 2016. He is a blockchain researcher who has worked for Blockgeeks and has done research work for several ICOs. He gets regularly invited to give talks on the blockchain technology and cryptocurrencies.

More from Rajarshi Mitra
Share:

Editor's Picks

Grass 20% bullish breakout defies broader market weakness

Grass (GRASS) is edging up above $0.30 at the time of writing on Monday. The token’s notable 20% intraday surge stands out amid heightened volatility in the broader crypto market.

XRP slides as US-Iran war weakens sentiment

Ripple remains under pressure, trading around $1.35 at the time of writing on Monday. The remittance token extended its down leg to $1.27 on Saturday after the US, in collaboration with Israel, launched attacks on Iran, killing the nation’s Supreme Leader, Ali Khamenei.

Crypto Today: Bitcoin pares losses, Ethereum and XRP drift lower as Middle East conflict pressures risk assets

Bitcoin, Ethereum and Ripple remain on edge as the Israel-US war on Iran risk-off sentiment. The Crypto King trades above $66,000 at the time of writing on Monday, but is struggling to break through the seller congestion around $67,000.

Bitcoin on brink of breakdown amid US-Iran war

Bitcoin (BTC) remains under pressure near the key support level of $65,700. Trading at $66,400 at the time of writing on Monday, a breakdown below this critical level would suggest a deeper correction ahead.

Bitcoin Price Annual Forecast: BTC holds long-term bullish structure heading into 2026

Bitcoin (BTC) is wrapping up 2025 as one of its most eventful years, defined by unprecedented institutional participation, major regulatory developments, and extreme price volatility.

Bitcoin: Another month of losses, and it’s been five

Bitcoin (BTC) price is stabilizing around $68,000 at the time of writing on Friday, but the Crypto King is poised to close February on a fragile footing, marking its fifth consecutive month of losses since October and a rare start to the year with back-to-back monthly corrections.