MATIC Price Prediction: Polygon pullback continues in tandem with declining network growth
- Polygon is testing the descending parallel channel’s boundary support following the retreat from $0.54.
- The slump in network growth adds credence to the bearish picture.
- Above the channels’ upper boundary, price action would trigger more orders as MATIC heads to new record highs.

Polygon has lost over 7% of its value in the last 24 hours. The asset is currently rebranding from MATIC and boasts of a market cap of $1.8 billion. In the last 24 hours, the token has attracted roughly $457 million in trading volume across all exchanges. Meanwhile, Polygon is teetering at $0.37 while declines linger.
Polygon least resistance path is downwards
MATIC is trading within a descending parallel channel. The channel’s middle boundary has anchored the immediate downside. Short-term analysis based on the Moving Average Convergence Divergence (MACD) suggests that declines are likely to continue.
The asset’s momentum indicator has a vivid bearish impulse. If the MACD line (blue) stays significantly under the signal line, selling pressure will rise appreciably. Similarly, action below the middle boundary support may trigger more sell orders, increasing the overhead pressure.
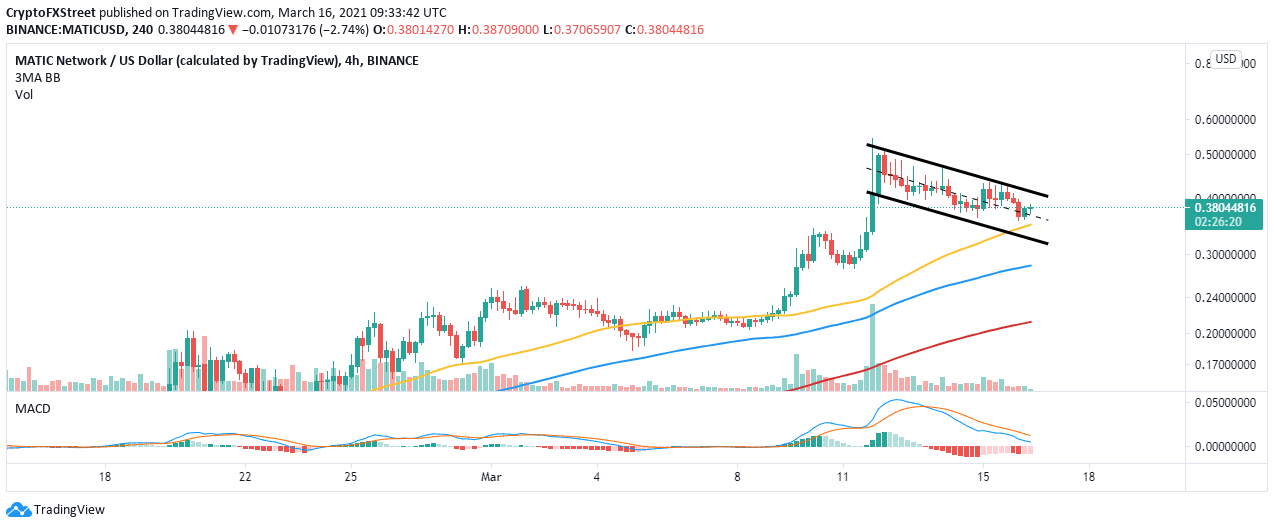
MATIC/USD 4-hour chart
On the downside, the 50 Simple Moving Average is in line to offer support. But if bypassed, buyers will be forced to seek support at the 100 SMA and 200 SMA, respectively.
The bearish narrative has been validated by a massive slump in the token’s network growth, as illustrated by Santiment’s on-chain data tools. The number of addresses joining the protocol daily topped out at 3,820 on March 12. However, at the time of writing, the addresses average at 1,856, representing a 51.4% drop.
A low or declining network growth is a bearish signal. It shows that the project is losing traction in adoption. This also affects the inflow and outflow of tokens on the network.
%20[12.55.23,%2016%20Mar,%202021]-637514859578902304.png)
Polygone network growth
Looking at the other side of the picture
It is essential to realize that that the descending channel’s middle support is still in place. If the price holds above this zone, buyers will begin to look upward towards $0.54. A break above the channel could trigger many buy orders, bolstering MATIC to assault the record high.
Author

John Isige
FXStreet
John Isige is a seasoned cryptocurrency journalist and markets analyst committed to delivering high-quality, actionable insights tailored to traders, investors, and crypto enthusiasts. He enjoys deep dives into emerging Web3 tren


