LTC/USD might soar by 31% over the next few weeks

Cryptocurrency activity has risen sharply over the last few days as Bitcoin is trading just below its all-time high and as many altcoins have seen a sharp boost. One of these coins is Litecoin, LTC/USD, and it has risen by 25% from last week's low. But the price has done more than that. It has also triggered a large double top pattern or ascending triangle pattern, depending on how you interpret the charts. I am viewing it as an ascending triangle, and that makes the price action very interesting.
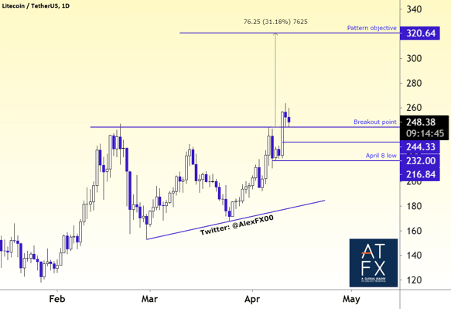
LTC/USD price trend to remain upwards above $232
The price was rejected at $244 on February 20 and April 6, and thereby forming a double top. The price is also supported by an upward pointing trend line that goes via February 28 low of $152.84 and March 25 low of $167.8. Together, the horizontal level and trend line provide us with an ascending triangle pattern, with a target of $320, a rise of about 31.5% from the breakout point of $244.33.
There are different ways to place the stop loss to protect the downside on a pattern like this, but the general idea is that the price is not allowed to trade deeply back into the pattern.
A longer-term trader that does not want to be too close to the price action would probably place the stop below the April 8 low of $216.84, while someone like myself would like to be close to the price and thereby increase the risk-reward ratio will focus on the $232 level.
As for latecomers' buy levels, they will probably focus on the £234 to £247.30 range.
What is your opinion? Interact with Alex via Twitter.
LTC/USD Daily Chart:
Author

Alejandro Zambrano is ATFX’s Global Chief Market Strategist. He combines extensive professional experience and a pragmatic attitude to trading, building clients’ understanding of the markets and the rationale behind investing.


![Hyperliquid representatives, Trade[XYZ] meet SEC Crypto Task Force to discuss digital asset regulation](https://editorial.fxsstatic.com/images/i/Hyperliquid_Bull.png)
