|

Loopring price ready to resume uptrend following LRC’s 34% correction

  • Loopring price had a major rally towards $0.621 but also suffered a significant 34% correction.
  • The digital asset has bounced back up from a low of $0.4 as several indicators show it’s poised for a recovery.

Loopring saw a 260% rally in the past three days from a low of $0.17 to a two-year high at $0.621. The digital asset had its biggest trading volume spike at $1 billion in 24 hours and it’s still in an uptrend.

Loopring needs to defend crucial support level to resume uptrend

LRC has found strong support at $0.4 and has experienced a 21% bounce from this level. The digital asset remains bullish and the TD Sequential indicator has just presented a buy signal in the form of a red ‘9’ candlestick on the 2-hour chart.
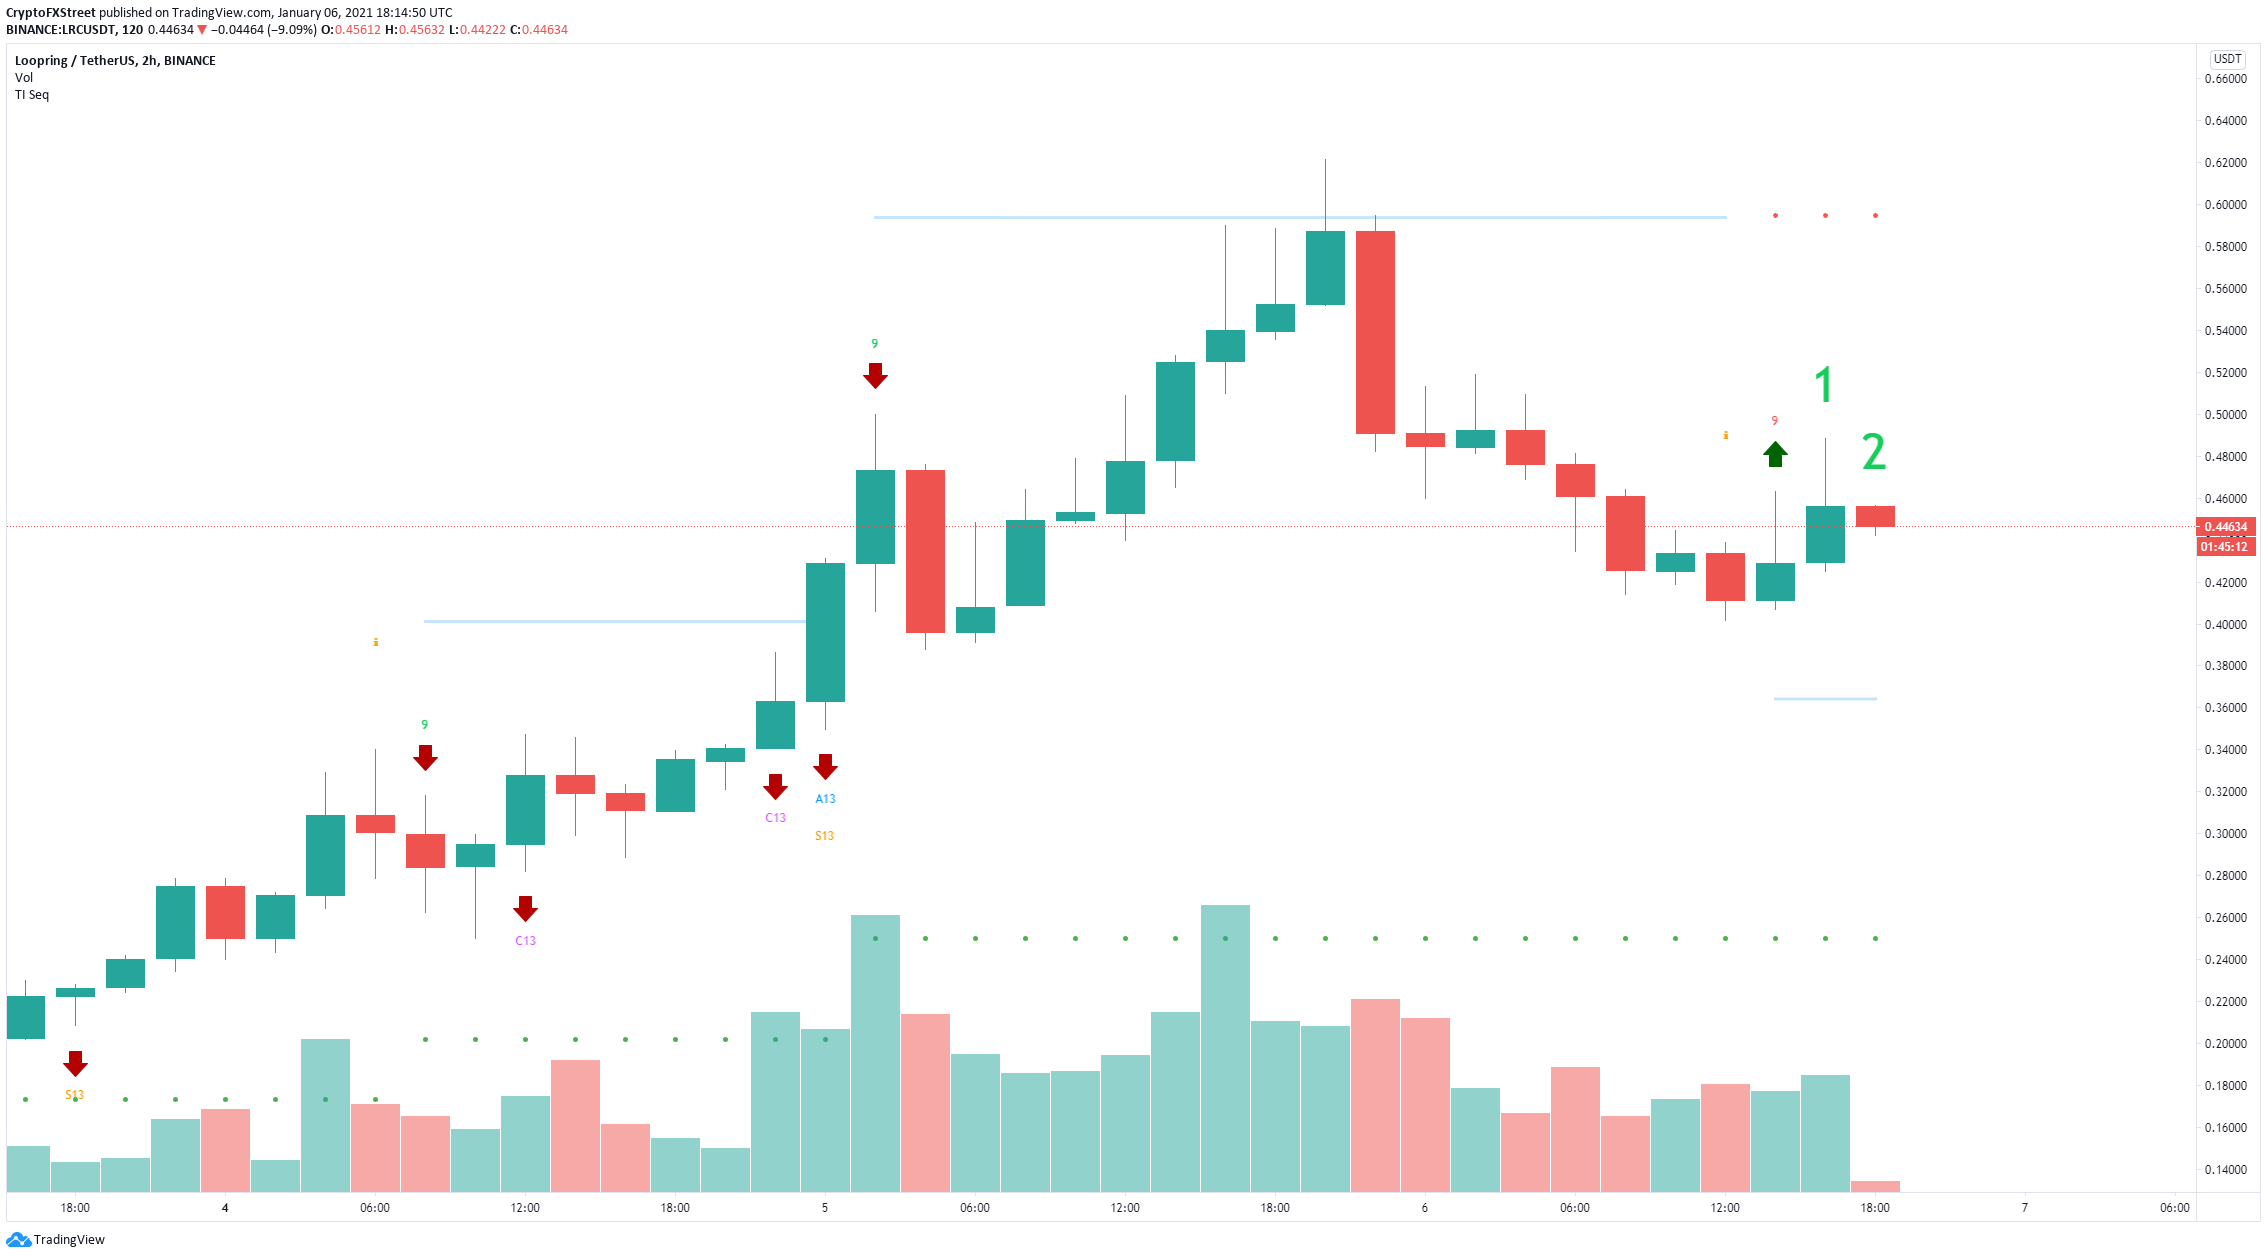
LRCUSDT

LRC/USD 2-hour chart

The In/Out of the Money Around Price (IOMAP) chart indicates that the strongest support area is located between $0.396 and $0.41, which adds credence to the bullish outlook above. It also shows very little resistance to the upside when compared to the $0.4 support point.
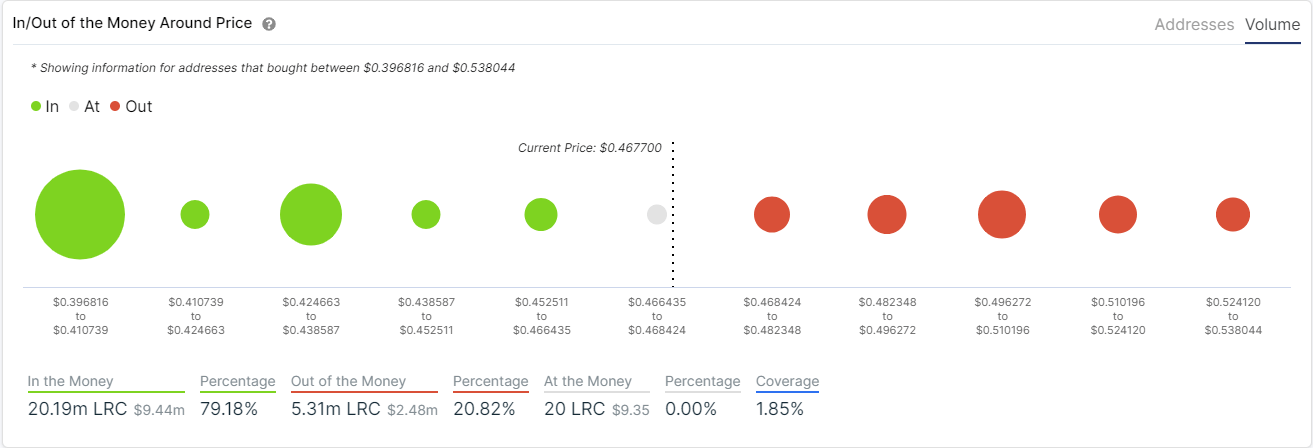
lrc price

LRC IOMAP chart

However, the $0.4 support level is the only strong one nearby. If bulls fail to hold this point and LRC drops below it, it could easily dip towards the psychological level at $0.3 in the longer-term, which would be a clear shift in favor of the bears.

Author

Lorenzo Stroe

Lorenzo Stroe

Independent Analyst

Lorenzo is an experienced Technical Analyst and Content Writer who has been working in the cryptocurrency industry since 2012. He also has a passion for trading.


More from Lorenzo Stroe
Share:

Editor's Picks

Pi Network extends consolidation as bulls eye $0.10

Pi Network price holds steady on Friday, maintaining a consolidating tone for three consecutive days. Mild retail strength in the PI token remains stable, with Open Interest above $9 million, while social buzz eases.

Bitcoin Weekly Forecast: Hormuz uncertainty clouds BTC outlook

Bitcoin trades around $62,900 on Friday, down over 3% so far this week, but signs of stabilization are emerging. Tensions in the Strait of Hormuz are keeping Oil prices and the war-risk premium elevated, supporting the US Dollar and weighing on BTC.

Crypto Today: Bitcoin, Ethereum, and Ripple risk steeper correction as bearish pressure mounts

Bitcoin trades below $63,000 on Friday, projecting a downside bias as selling pressure resurfaces. Ethereum and Ripple also take a bearish path, risking a drop below the 50-day Exponential Moving Average at $1,856 and the $1.00 psychological support, respectively.

Bitcoin SV Price Forecast: BSV hits three-month high, eyeing 200-day EMA breakout

Bitcoin SV (BSV) is up nearly 2% on Friday, extending a steady upward trend over the last two weeks. Retail strength builds in BSV amid multiple vulnerabilities found in the Bitcoin ecosystem.

Bitcoin: Hormuz uncertainty clouds BTC outlook
Bitcoin (BTC) trades around $62,900 at the time of writing on Friday, down over 3% so far this week amid cautious institutional demand and persistent geopolitical uncertainty. While BTC shows signs of stabilization, elevated Oil prices and tensions in the Strait of Hormuz continue to weigh on risk sentiment, keeping the Crypto King’s near-term outlook under pressure.

