Litecoin Price Prediction: LTC to hold $100 support as traders deploy $10M of leverage
- Litecoin price consolidated above $110 on Tuesday after the crypto market crash on December 9 triggered a 20% correction.
- Derivative markets data shows LTC bulls deployed $10.8 million worth of leverage around the $100 support level.
- The Relative Strength Index (RSI) indicator on the LTCUSD 4-hourly chart signals improvement in the market momentum

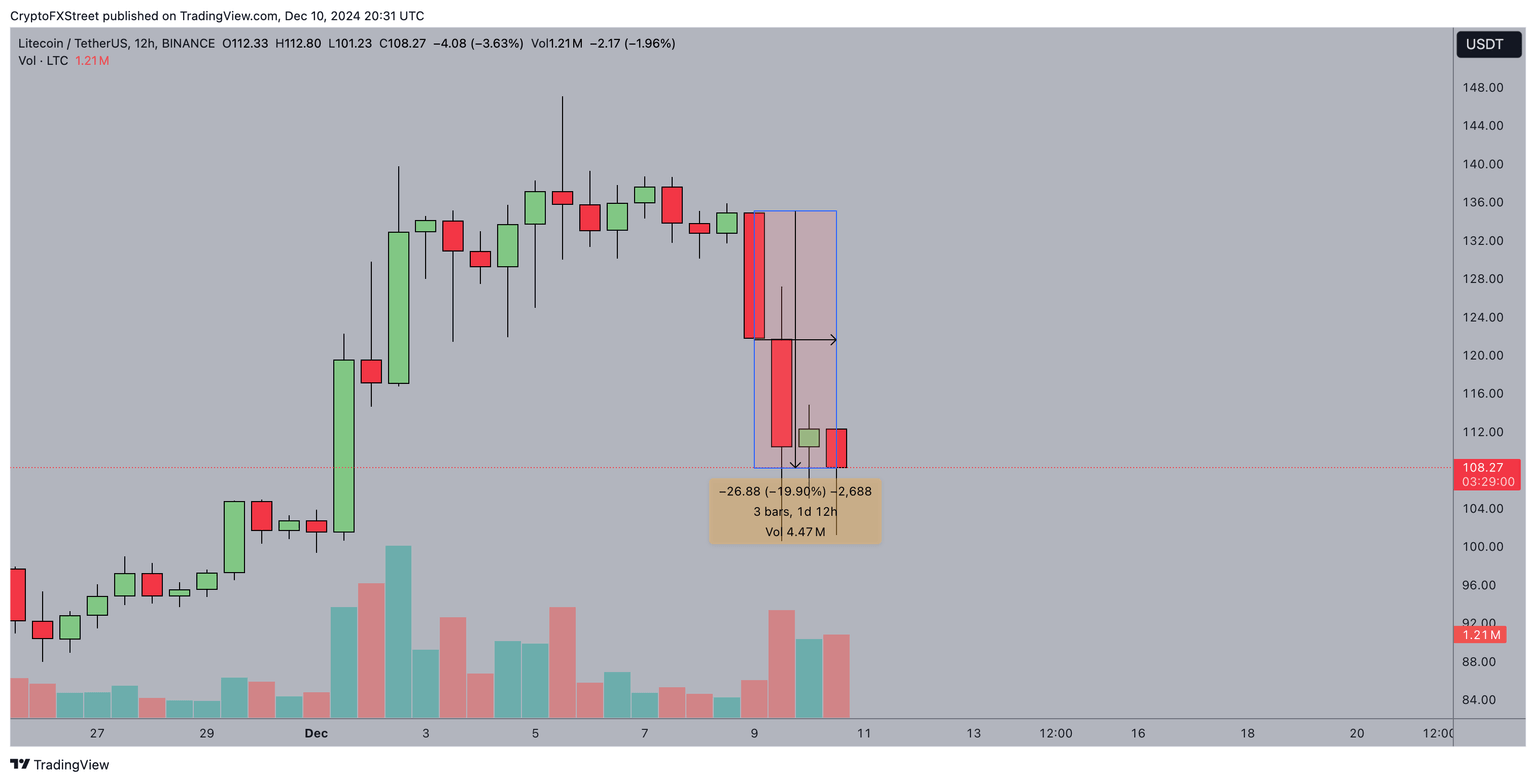
Litecoin price broke below the $110 level on Tuesday, down 20% in a frenetic 24 hours as rising geopolitical risks triggered volatility across global crypto markets.
Derivatives markets data show that LTC bulls have deployed considerable leverage around the $100 support level.
Will LTC price decline further or stage an early rebound?
Litecoin price tumbles 20% amid crypto market crash
After a positive start to December, the global crypto market has entered a steep downtrend over the last 48 hours with Litecoin (LTC) emerging among the loss leaders.
Based on recent global news reports, the crypto market crash can be linked to rising geopolitical crises in the Middle East and Asia.
The chart above shows how Litecoin price tumbled by 20% in the last 36 hours, dropping from $135 on Monday to hit the $108 mark at the time of writing.
This makes Litecoin one of the biggest losers on the day, with many over-leveraged traders caught unaware after the p2p payment network had delivered a chart-topping 46% gain in the first four days of December.
Bulls deploy $10M leverage around $100 support
After 20% losses, bullish traders are now making strategic moves to step in and avert a potential breakdown below the $100 psychological support.
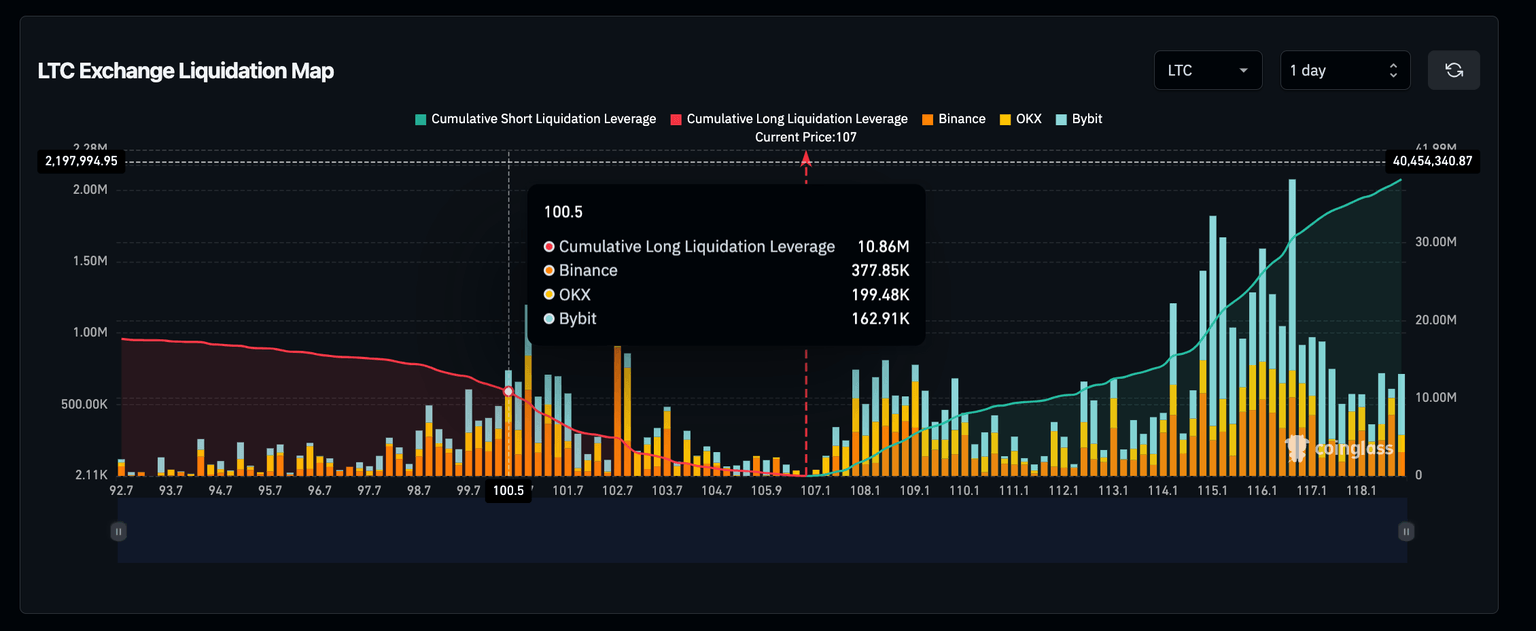
In affirmation of this stance, current trends observed in the LTC derivatives market shows bulls mounting a support cluster around the $100 price level.
Coinglass Liquidation map data tracks the total value of active leveraged positions listed around specific price levels.
At first glance the chart above reflects the market-wide bearish sentiment with leveraged short LTC positions worth $118.9 million, far outpacing active long contracts of $17.63 million.
But zooming in, the chart shows bulls have mounted over 52% of the current leverage positions around the $100 level.
When traders deploy an overwhelming large volume of leverage around a specific price point, it signals that a high number of traders could potentially book significant losses if prices fall below that level.
Based on the current dynamics, Litecoin traders with active leveraged long positions are likely to make rapid covering purchases in the spot market to prevent a breakdown below the $100 resistance.
If this scenario plays out, the demand surge from the covering purchases could potentially slow down the price correction phase in the days ahead.
And if market sentiment around the geopolitical risk factors abate, this could effectively set the stage for the next Litecoin price rebound phase.
Litecoin price forecast: $100 support level under pressure as bears remain dominant
Litecoin price action remains in bearish territory after market liquidation triggered a rapid 20% downsizing. However, bulls are now making strategic moves to hold the $100 support level.
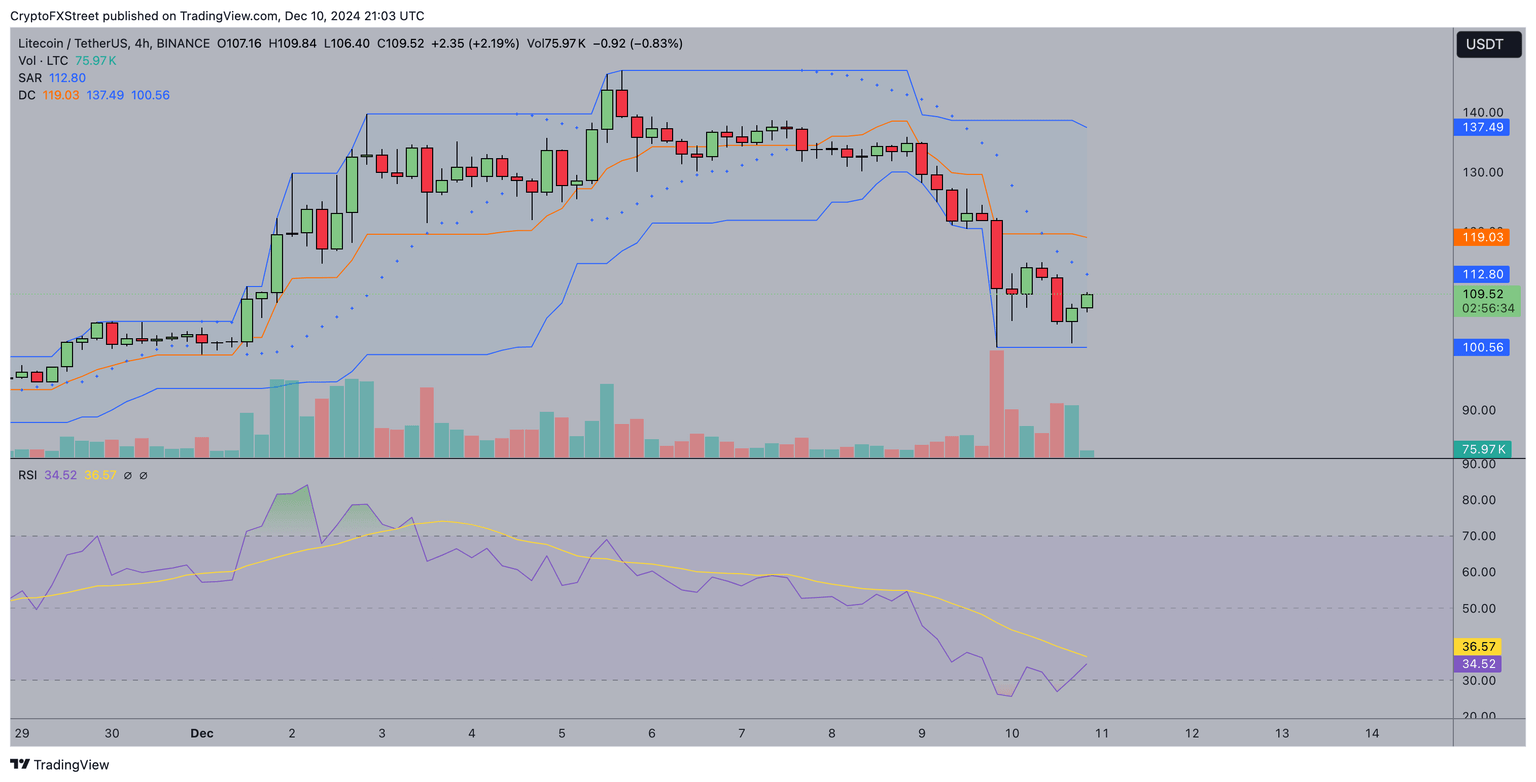
Technical indicators on the LTC/USD 4-hour price chart also support this mildly optimistic outlook. First, the Parabolic SAR indicator stationed at $112, just above the current price of $110, highlights dominant bearish momentum.
However, the Donchian Channels lower band shows clear support at $100, where leveraged traders have concentrated buying interest, creating a critical defense zone.
More so, the RSI recently crossed above 30 from below, signaling an improvement in momentum that could attract strategic buyers looking to re-enter the market at the bottom.
If bulls defend $100 successfully, the next resistance lies at $112, aligned with the upper Donchian Channel band.
A decisive breakout above the $119 level would mark the start of a rebound phase.
On the flipside, failure to sustain $100 might lead to a drop toward the next support at $95, likely opening the doors to larger losses within the weekly time frame.
Author

Ibrahim Ajibade
FXStreet
Ibrahim Ajibade is an accomplished Crypto markets Reporter who began his career in commercial banking. He holds a BSc, Economics, from University of Ibadan.


