Litecoin Price Prediction: LTC ready for a massive rebound, targeting $100


  • Litecoin is on the verge of a breakout to $100, mostly if the seller congestion at $80 is overcome.
  • The bullish narrative might be invalidated if the TD Sequential indicator’s sell signal on the weekly chart is confirmed.

Litecoin is in the middle of a recovery mission after bouncing off the support of $64. The digital asset is trading at $79 while battling the resistance at $80. A break above $80 is likely to catapult LTC towards the coveted $100.

Litecoin prepares for the rally to $100

Holding above the 50-day Simple Moving Average has been a critical bullish indicator that the uptrend would continue. Besides, the Relative Strength Index hit support at the midline and recovered towards the overbought region.

As the resistance at $80 becomes an uphill battle, the RSI starts to level, hinting at consolidation. However, a spike above $80 would call for more buy orders, creating enough volume for gains above $90 and $100, respectively.

LTC/USD price chart

LTC/USD daily chart

The 4-hour chart confirms the selling pressure at $80, but if Litecoin closed the day above the 50 SMA, a breakout might ensue, targeting $90 and $100. On the downside, immense support is expected at the 100 SMA to help refocus LTC in case of a correction from the hurdle.

LTC/USD price chart

LT C/USD 4-hour chart

IntoTheBlock’s IOMAP model reveals a relatively smooth path to $90. Meanwhile, buyers must focus on breaking the resistance between $81.5 and $84. Here, roughly 43,600 addresses had previously bought nearly 1.2 million LTC. With enough buying pressure, LTC could extend the uptrend to $100.

Litecoin IOMAP chart

Litecoin IOMAP chart

On the downside, immense support behind the cryptocurrency shows that the uptrend could remain intact. The most robust buyer congestion zone runs from $69.7 to $72. Here, about 45,000 addresses had previously bought roughly 4.1 million LTC. It is doubtful that declines will overshoot this support range to retest last week’s anchor at $64.

LTC/USD price chart

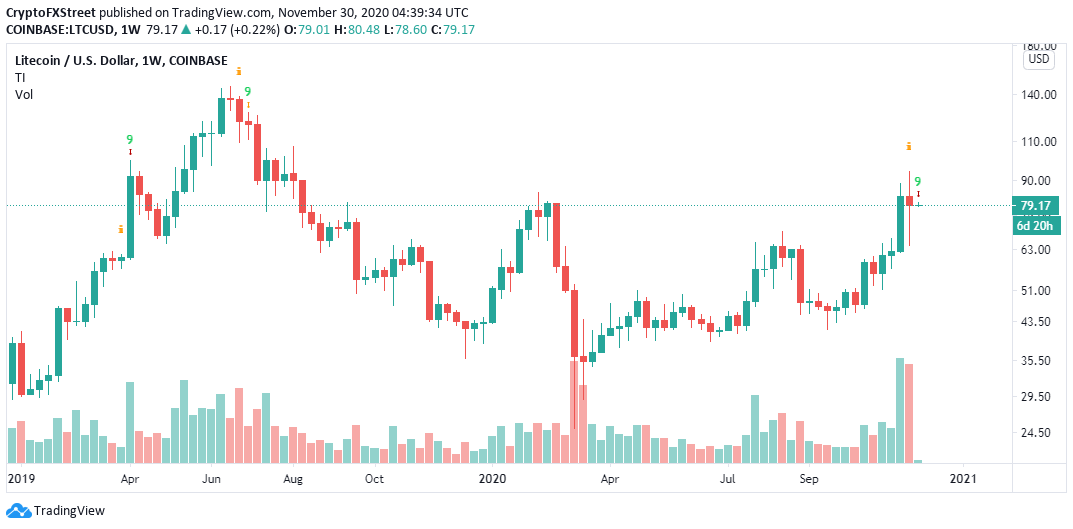
LTC/USD weekly chart

It is worth mentioning that the TD Sequential indicator has presented a sell signal on the weekly chart. The call has manifested in a green nine candlestick. If the signal is validated, Litecoin might fall in one to four daily candlesticks. Moreover, an increase in LTC supply could see the price get back to the gains-trimming exercise where losses could overshoot the support at $64.


Information on these pages contains forward-looking statements that involve risks and uncertainties. Markets and instruments profiled on this page are for informational purposes only and should not in any way come across as a recommendation to buy or sell in these assets. You should do your own thorough research before making any investment decisions. FXStreet does not in any way guarantee that this information is free from mistakes, errors, or material misstatements. It also does not guarantee that this information is of a timely nature. Investing in Open Markets involves a great deal of risk, including the loss of all or a portion of your investment, as well as emotional distress. All risks, losses and costs associated with investing, including total loss of principal, are your responsibility. The views and opinions expressed in this article are those of the authors and do not necessarily reflect the official policy or position of FXStreet nor its advertisers. The author will not be held responsible for information that is found at the end of links posted on this page.

If not otherwise explicitly mentioned in the body of the article, at the time of writing, the author has no position in any stock mentioned in this article and no business relationship with any company mentioned. The author has not received compensation for writing this article, other than from FXStreet.

FXStreet and the author do not provide personalized recommendations. The author makes no representations as to the accuracy, completeness, or suitability of this information. FXStreet and the author will not be liable for any errors, omissions or any losses, injuries or damages arising from this information and its display or use. Errors and omissions excepted.

The author and FXStreet are not registered investment advisors and nothing in this article is intended to be investment advice.

Join Telegram

Recommended content


Recommended Content

Editors’ Picks

PancakeSwap loses nearly 3% value intraday as the DEX crosses $1 billion in trade volume

PancakeSwap loses nearly 3% value intraday as the DEX crosses $1 billion in trade volume

Decentralized exchange (DEX) PancakeSwap (CAKE) announced in an official tweet that it has crossed $1 billion in trade volume on the Layer 2 chain, Base. CAKE on-chain metrics support the thesis of a recovery in the DEX token’s price. 

More Cryptocurrencies News

Shiba Inu hits new milestone, over $9 billion worth of SHIB tokens burnt

Shiba Inu hits new milestone, over $9 billion worth of SHIB tokens burnt

Shiba Inu (SHIB), the second-largest meme coin in the crypto ecosystem, recently hit a milestone in the volume of tokens burned. Shiba Inu has burnt over 410.72 trillion SHIB tokens since the inception of the burn mechanism in the project, worth over $9 billion.

More Shiba Inu News

Dogwifhat crashes 60%, but here's why you should not buy WIF yet Premium

Dogwifhat crashes 60%, but here's why you should not buy WIF yet

Dogwifhat (WIF) price shows a slowdown in the bearish momentum as it sets up a potential range. This development could lead to a good buying opportunity from a long-term perspective. 

More Dogwifhat News

XRP struggles to overcome $0.50 resistance, SEC vs. Ripple could enter final pretrial conference

XRP struggles to overcome $0.50 resistance, SEC vs. Ripple could enter final pretrial conference

XRP is struggling with resistance at $0.50 as Ripple and the US Securities and Exchange Commission (SEC) are gearing up for the final pretrial conference on Tuesday at a New York court. 

More Ripple News

Bitcoin: BTC’s rangebound movement leaves traders confused

Bitcoin: BTC’s rangebound movement leaves traders confused

Bitcoin (BTC) price has been hovering around the $70,000 psychological level for a few weeks, resulting in a rangebound movement. This development could lead to a massive liquidation on either side before a directional move is established. 

Read full analysis

BTC

ETH

XRP