Litecoin Price Forecast: LTC/USD defends critical support, new uptrend eyes $80 – Confluence Detector


  • Litecoin builds upon the confluence support levels above $70 to sustain gains to $80.
  • LTC/USD has to close the day above the 50 SMA on the 4-hour chart to confirm the expected breakout.

Litecoin embraced support at $65 following a sharp drop on Thursday. A higher short term anchor has been established at $70. LTC/USD is trading at $72 amid a consistent push for further recovery from the bulls.

Litecoin bulls fix their eyes on $80 as recovery looms

LTC is trading above the 50 Simple Moving Average, which gives credence to the bullish narrative. Note that Litecoin has not exchanged hands beneath this crucial level since mid-October.

The 50 SMA is still increasing the gap above the 100 SMA and the 200 SMA, suggesting that buyers have the upper hand. Resistance is anticipated at $80 and is likely to delay the uptrend targeting $90 and $100, respectively.

LTC/USD price chart

LTC/USD daily chart

The TD Sequential indicator has presented a buy signal in the form of a red nine candlestick on LTC’s 4-hour chart. The bullish formation approximates that a surge in demand for Litecoin could see it spike for one to four daily candlesticks. Note that if buying pressure consistently builds, LTC/USD might begin a new uptrend toward $100.

LTC/USD price chart

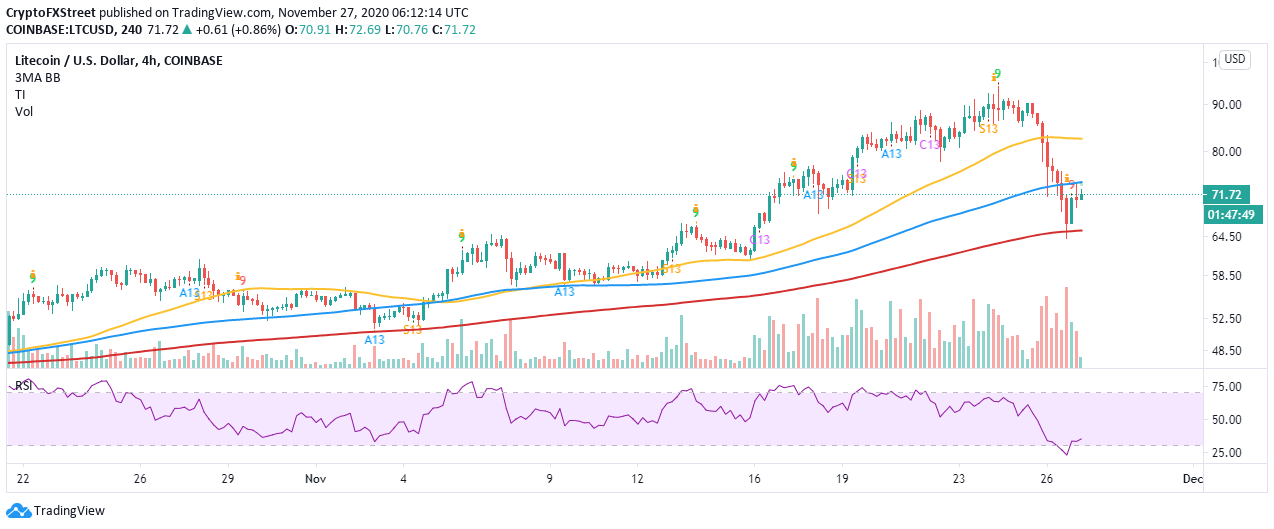
LTC/USD 4-hour chart

The same 4-hour chart shows that if Litecoin closed the day above the 50 SMA, a breakout might come into the picture for gains eyeing $80 and beyond. Similarly, the Relative Strength Index has recovered from the oversold, thus reinforcing the bullish outlook.

According to the confluence detector, Litecoin is sitting on areas with immense support. The initial anchor is seen at $71.9, as highlighted by the One-day Bollinger Band middle boundary, the previous low 15-minutes, and the previous high one-hour.

The second robust support lies at $71.7 and is home to the Fibonacci 38.2% one-day and the 15-minutes Bollinger Band middle boundary. On the upside, trading above the confluence resistance at $72.9 might trigger a rally to $80.

fxsoriginal

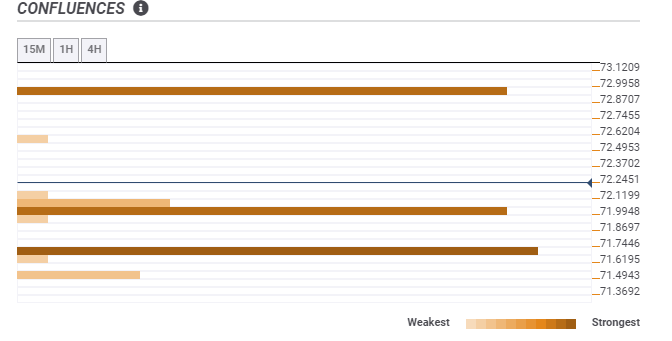
LTC/USD confluence chart

It is worth mentioning that if the price closed the day under the 50 SMA on the 4-hour chart, Litecoin might be forced to abandon the bullish outlook. On the other hand, breaking below the confluence support could trigger massive declines, perhaps strong enough to overshoot the next critical support at the 200 SMA in the same 4-hour timeframe.


Information on these pages contains forward-looking statements that involve risks and uncertainties. Markets and instruments profiled on this page are for informational purposes only and should not in any way come across as a recommendation to buy or sell in these assets. You should do your own thorough research before making any investment decisions. FXStreet does not in any way guarantee that this information is free from mistakes, errors, or material misstatements. It also does not guarantee that this information is of a timely nature. Investing in Open Markets involves a great deal of risk, including the loss of all or a portion of your investment, as well as emotional distress. All risks, losses and costs associated with investing, including total loss of principal, are your responsibility. The views and opinions expressed in this article are those of the authors and do not necessarily reflect the official policy or position of FXStreet nor its advertisers. The author will not be held responsible for information that is found at the end of links posted on this page.

If not otherwise explicitly mentioned in the body of the article, at the time of writing, the author has no position in any stock mentioned in this article and no business relationship with any company mentioned. The author has not received compensation for writing this article, other than from FXStreet.

FXStreet and the author do not provide personalized recommendations. The author makes no representations as to the accuracy, completeness, or suitability of this information. FXStreet and the author will not be liable for any errors, omissions or any losses, injuries or damages arising from this information and its display or use. Errors and omissions excepted.

The author and FXStreet are not registered investment advisors and nothing in this article is intended to be investment advice.

Recommended content


Recommended Content

Editors’ Picks

Pi Network Price Forecast: PI holds a crucial support level amid rising selling pressure

Pi Network Price Forecast: PI holds a crucial support level amid rising selling pressure

Pi edges lower to retest a crucial support level as it decouples from the broader market recovery. PI token unlocks and increasing balance on CEXs boost selling pressure.

Dogecoin, Shiba Inu face profit-taking risk as Bitcoin's rally takes a breather 

Dogecoin, Shiba Inu face profit-taking risk as Bitcoin's rally takes a breather 

Dogecoin and Shiba Inu are frontlining meme coins losses on Tuesday, following a strong uptrend the previous day. The surge in the prices of DOGE, SHIB and other crypto assets followed in the footsteps of Bitcoin, which hit a new record high of $123,218 on Monday.

Meme Coins Price Prediction: Solana-based BONK, PENGU, WIF could lead the next market bull run

Meme Coins Price Prediction: Solana-based BONK, PENGU, WIF could lead the next market bull run

Bonk’s breakout rally gains traction, printing its fourth consecutive bullish candle. Pudgy Penguins' steadies amid the announcement of the upcoming launch of a multiplayer game, eyes further gains.

Crypto Today: Bitcoin, Ethereum, XRP trim gains amid declining ETF inflows and profit-taking 

Crypto Today: Bitcoin, Ethereum, XRP trim gains amid declining ETF inflows and profit-taking 

Bitcoin encounters volatility and slips toward $116,000 as investors book profits from the rally to record highs. Ethereum bears take back control as ETH drops below $3,000 ahead of US CPI data.

Bitcoin: BTC hits new all-time high and enters price discovery mode

Bitcoin: BTC hits new all-time high and enters price discovery mode

Bitcoin price prints a new all-time high near $118,900 on Friday, entering uncharted territory as bullish momentum accelerates. The surge in BTC was supported by rising corporate and institutional demand, with spot Bitcoin ETFs recording a total of $1.69 billion this week as of Thursday. 

The Best brokers to trade EUR/USD

The Best brokers to trade EUR/USD

SPONSORED Discover the top brokers for trading EUR/USD in 2025. Our list features brokers with competitive spreads, fast execution, and powerful platforms. Whether you're a beginner or an expert, find the right partner to navigate the dynamic Forex market.

BTC

ETH

XRP