• Litecoin encounters resistance at $90, delaying price action to $95 and $100, respectively.
  • LTC/USD could get into a consolidation period based on the IOMAP model.

Litecoin recently closed in on $100 but hit a barrier at $95. The cryptoasset led other altcoins such as Ethereum into the bull cycle, as extensively covered earlier. A reversal appears imminent, notably if LTC drops below the ascending wedge pattern.

Litecoin under significant risk of losses towards $70

LTC/USD is trading at $87 after confirming short term support at $85. The immediate upside has been capped at $90, thus delaying recovery to $95 and $100, respectively. If the price fails to close the day above $90 again, selling pressure may surge, triggering declines towards $70.

The daily chart brings to light the formation of an ascending wedge pattern, which shows that the Litecoin uptrend is nearing exhaustion and a correction is around the corner. In other words, buying pressure has reduced significantly and a reversal seems imminent. Trading below the wedge may reinforce the selling pressure, pulling LTC back to $70.

LTC/USD price chart

LTC/USD daily chart

The TD Sequential indicator is likely to present a sell signal on the 3-day chart in the coming few days. This signal will take the form of a green nine candlestick. If validated, it may lead to declines in one to four daily candlesticks, thereby validating the bearish narrative.
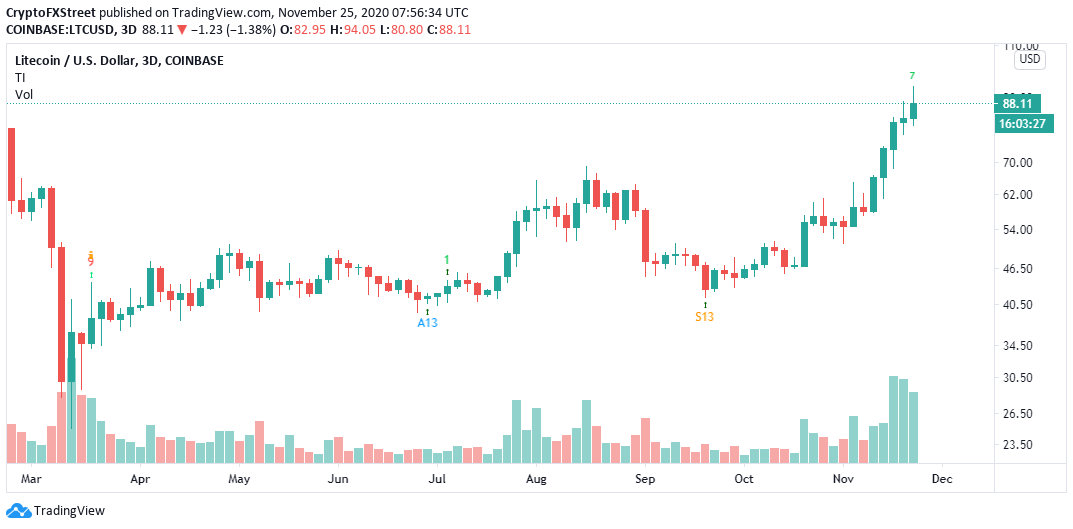
LTC/USD price chart

LTC/USD 3-day chart

Santiment, a leading provider of on-chain metrics, shows that the transaction volume within the Litecoin network has gone down incredibly. The metric shows the aggregate of the tokens and all daily transactions taking place.

Usually, a spike in the volume is succeeded by growth in the value of the token. On the other hand, low volumes point towards falling prices or consolidation. In this case, Litecoin could drop following the significant decrease in the transaction volume.

LTC daily transaction volume

Litecoin transaction volume chart

LTC trapped between big support and resistance areas

IntoTheBlock’s IOMAP model reveals that Litecoin is stuck between immense resistance and support zones. On the upside, the price movement has been capped by the seller congestion between $88 and $90. Here, nearly 47,000 addresses had previously purchased roughly 1.8 million LTC.

Litecoin IOMAP model

Litecoin IOMAP model

On the flipside, Litecoin is sitting on immense support zones, starting with the range between $85 and $87.8. Here, approximately 71,200 addresses had previously bought around 1.4 million LTC. The support area is also resting on top of other massive buyer congestion zones. Therefore, it is doubtful that LTC will drop to $70, thus invalidating the bearish outlook.


Information on these pages contains forward-looking statements that involve risks and uncertainties. Markets and instruments profiled on this page are for informational purposes only and should not in any way come across as a recommendation to buy or sell in these assets. You should do your own thorough research before making any investment decisions. FXStreet does not in any way guarantee that this information is free from mistakes, errors, or material misstatements. It also does not guarantee that this information is of a timely nature. Investing in Open Markets involves a great deal of risk, including the loss of all or a portion of your investment, as well as emotional distress. All risks, losses and costs associated with investing, including total loss of principal, are your responsibility. The views and opinions expressed in this article are those of the authors and do not necessarily reflect the official policy or position of FXStreet nor its advertisers. The author will not be held responsible for information that is found at the end of links posted on this page.

If not otherwise explicitly mentioned in the body of the article, at the time of writing, the author has no position in any stock mentioned in this article and no business relationship with any company mentioned. The author has not received compensation for writing this article, other than from FXStreet.

FXStreet and the author do not provide personalized recommendations. The author makes no representations as to the accuracy, completeness, or suitability of this information. FXStreet and the author will not be liable for any errors, omissions or any losses, injuries or damages arising from this information and its display or use. Errors and omissions excepted.

The author and FXStreet are not registered investment advisors and nothing in this article is intended to be investment advice.

Join Telegram

Recommended content


Recommended Content

Editors’ Picks

Ripple wipes out weekly gains, experts comment on role of Ripple stablecoin

Ripple wipes out weekly gains, experts comment on role of Ripple stablecoin

Ripple declined to $0.52 on Thursday, erasing all gains registered earlier this week. Ripple SVP Eric van Miltenburg’s comments on the firm’s stablecoin, and how it is expected to benefit the XRP Ledger and native token XRP have raised concerns among crypto experts. 

More Ripple News

Hedera HBAR slips nearly 10% after air is cleared on mistaken link with giant BlackRock

Hedera HBAR slips nearly 10% after air is cleared on mistaken link with giant BlackRock

HBAR price is down nearly 10% on Thursday, partly erasing gains inspired by the misinterpreted link with BlackRock. Despite the recent correction, Hedera’s price is up 44% in the past seven days.

More Hedera News

The reason behind Bonk’s 105% rise and if you should buy now Premium

The reason behind Bonk’s 105% rise and if you should buy now

Bonk price has shot up 105% in the past five weeks. A retracement into $0.0000216 or the $0.0000152 to $0.0000186 imbalance would be a good buying opportunity. Patient investors can expect double-digit gains from BONK that could extend up to 70%.

More Cryptocurrencies News

Injective price weakness persists despite over 5.9 million INJ tokens burned

Injective price weakness persists despite over 5.9 million INJ tokens burned

Injective price is trading with a bearish bias, stuck in the lower section of the market range. The bearish outlook abounds despite the network's deflationary efforts to pump the price. Coupled with broader market gloom, INJ token’s doomed days may not be over yet.

More Injective News

Bitcoin: BTC post-halving rally could be partially priced in Premium

Bitcoin: BTC post-halving rally could be partially priced in

Bitcoin (BTC) price briefly slipped below the $60,000 level for the last three days, attracting buyers in this area as the fourth BTC halving is due in a few hours. Is the halving priced in for Bitcoin? Or will the pioneer crypto note more gains in the coming days? 

Read full analysis

BTC

ETH

XRP