Litecoin leading the most recent run-up, and these altcoins may follow
- Litecoin's breakout this week paints a bullish picture for larger altcoins like Ethereum and Chainlink.
- Ethereum is on the verge of completing the leg to $520, but the resistance at $495 must come down.
- Chainlink eyes a breakout to $20 as long as buyers overcome the hurdle at the descending parallel channel.

Litecoin has stood out this week after shooting upwards by more than 23% in 48 hours. In previous run-ups, Litecoin tended to lead the altcoins' breakout. Tokens such as Ethereum (ETH) and Chainlink (LINK) joined the rally, spiking to higher levels.
Litecoin's recent rally could signal an uptrend in other altcoins
Litecoin seems to be leading the way for major altcoins, and perhaps ETH and LINK will follow. A glance into the past reveals that LTC is notorious for kick-starting bull runs for these tokens. For example, Litecoin surged in April 2019 by more than 67%, from $60 to $100. The impressive rally took place before the remarkable recovery witnessed across the cryptocurrency market in May 2019.
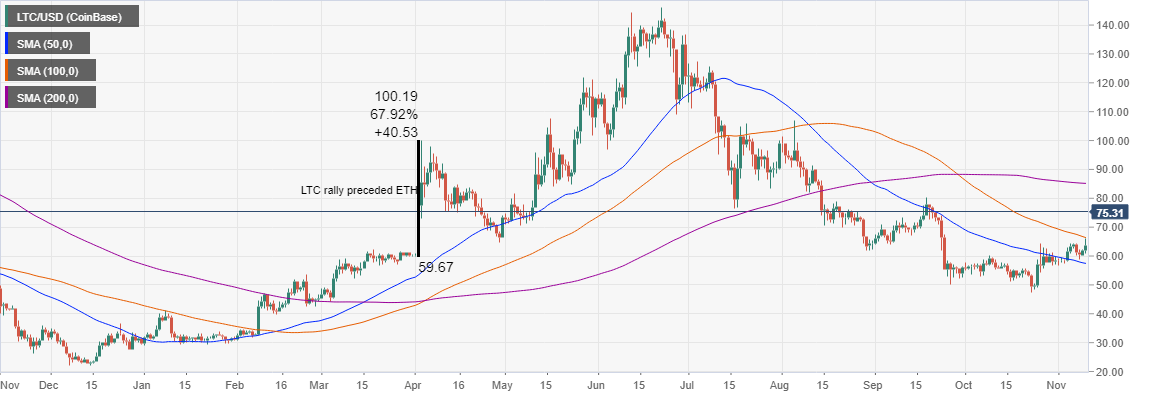
LTC/USD daily chart
Ethereum commenced its bullish momentum at the beginning of May. The price action was majestic so that Ether almost doubled in value from $145 to $288, achieved on May 30, 2019.

ETH/USD daily chart
Chainlink, like Ethereum, followed in the footsteps of Litecoin. LINK soared by 268% from $0.4 toward the end of April to $1.5 in mid-May. With such a massive breakout, LINK and ETH may likely rebound to hit new yearly highs before the year comes to an end.
-637412760544526877.png)
LINK/USD daily chart
Ethereum rally is in the initial phases
At the time of writing, Ether is trading 32% higher from the lowest level in November. Similarly, the smart contract token has stepped to new yearly highs after overcoming the $490 seller congestion zone. A break above the resistance at $495 may quickly push Ethereum to $520, as discussed earlier this week.
 - 2020-11-18T082430.316-637412761107221244.png)
ETH/USD daily chart
As for Chainlink, a possibility exists for a breakout to $20 if the immediate ascending parallel channel resistance is broken. On the downside, the oracle token is trading above the 50-day Simple Moving Average. Additionally, the channel's middle boundary is in line to prevent losses from resuming towards $10.

LINK/USD daily chart
On the other hand, history shows that when Litecoin is leading a bull-run, it reverses before starting the spike fresh alongside other altcoins. It also explains the ongoing retreat after the 23% rally. LTC hit a wall at $77 and is currently trading at $73.
 (8)-637412762204988086.png)
LTC/USD 4-hour chart
The Relative Strength Index reinforces the bearish outlook following a bearish divergence formed by hitting a higher high in the overbought region followed by a higher low. If support at $70 fails to hold, LTC might revisit the 50 SMA, marginally below $65. Other critical levels to keep in mind include the 100 SMA and the 200 SMA.
Author

John Isige
FXStreet
John Isige is a seasoned cryptocurrency journalist and markets analyst committed to delivering high-quality, actionable insights tailored to traders, investors, and crypto enthusiasts. He enjoys deep dives into emerging Web3 tren


