Litecoin Price Prediction: LTC pullback to $50 seems imminent before breaking out
- PayPal's support for Litecoin triggered the recent upward price action.
- LTC/USD loses steam towards $60 as investors sell the news; correction to $50 is likely.

Litecoin traded within a whisker of $70 in August following a remarkable recovery from March's crash. However, the crypto asset resumed the downtrend within a descending parallel channel. For more than two months, LTC/USD sustained nursed wounds but was treated to occasional pull-ups.
September's support, marginally above $40, paved the way for the ongoing recovery. Litecoin made it above the channel resistance, extending the bullish leg beyond $50. Meanwhile, the bullish pressure appears to have run into immense seller congestion under $60.
The PayPal effect is dwindling
Litecoin's rally is attributed to the newly announced crypto service by PayPal. The platform will allow users to buy and sell cryptocurrencies like Bitcoin, Ethereum, Bitcoin Cash, and Litecoin. Users will also be allowed to purchase goods and services from 26 million merchants using these cryptocurrencies.
PayPal CEO Dan Schulman said that the move to digital payments was imminent. Digital payments bring forth efficiency, speed as well as resilience. The decision by PayPal to include cryptos as a service appears to be one of the most significant support for the cryptocurrency industry in 2020.
As the news settle, Litecoin appears to slip into retreat. The bullish outlook to $65, as discussed earlier, is unlikely to take place, at least for now. LTC/USD is exchanging hands slightly below $55.
Rejection and reversal on the horizon
The Relative Strength Index (RSI) brushed shoulders with the overbought area. While Litecoin is not quite oversold, a decreasing volume index suggests a breakdown is in the offing. Besides, a death cross is likely to come into the picture when the 100 Simple Moving Average (SMA) crosses beneath the 50 SMA in the daily timeframe.
LTC/USD daily chart
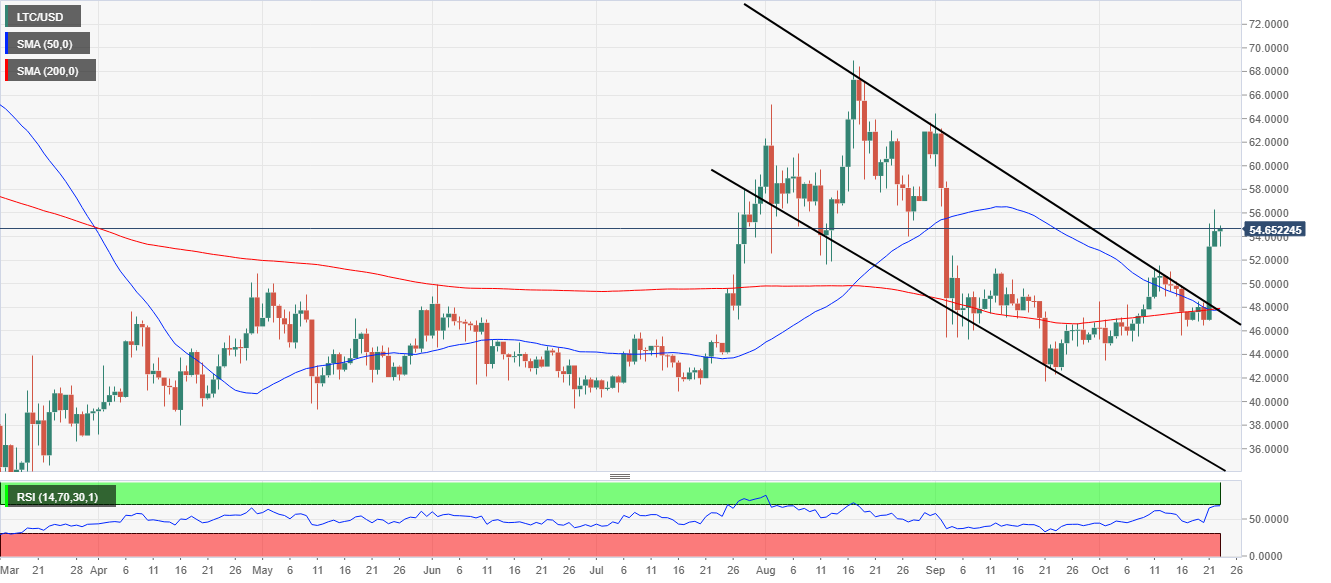
On the other hand, support is expected at $52, but LTC might revisit the $50 level if declines persist. The TD Sequential Indicator recently flashed a sell signal in the form of a green nine candlestick, adding weight to the bearish outlook.
All the three moving averages applied to this chart, the 50 SMA, 100 SMA and 200 SMA, turned into support areas. Therefore, declines are unlikely to extend below $50.
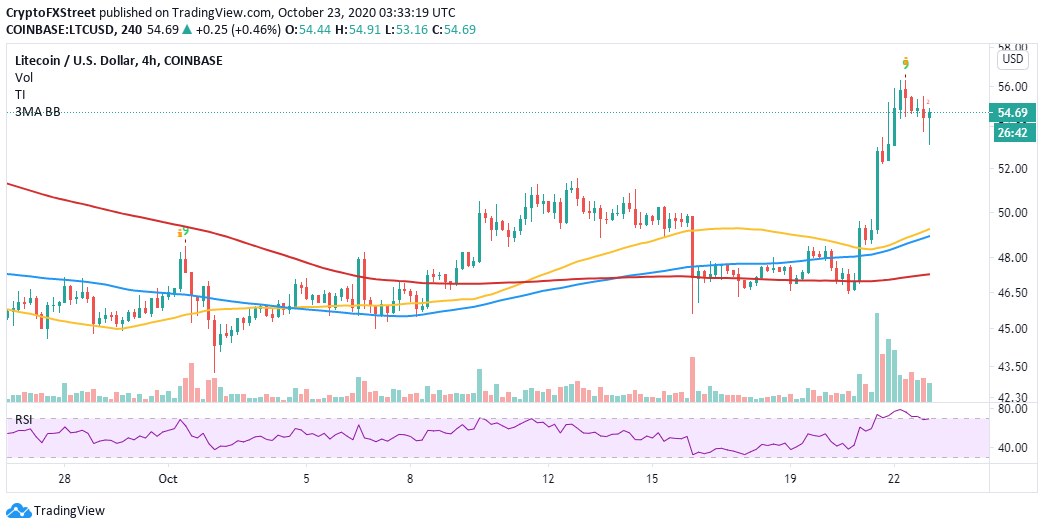
LTC/USD 4-hour chart
According to IntoTheBlock's IOMAP model, Litecoin is facing increasing resistance heading to $60. The most robust support zone runs from $60 to $61. Previously, nearly 54,000 addresses purchased roughly 2.3 million LTC in the range.
On the downside, the most vital anchor zone holds the ground between $50 and $52. Here, around 75,000 addresses previously bought approximately 3.5 million LTC. Losses below this area are doubtful; besides, buyers' immense concentration seems to extend to $46.
Litecoin IOMAP model
-637390231298502927.png)
Santiment, a leading provider of on-chain data, highlights a spike in Litecoin related social media mentions. The surge coincided with the news from PayPal, followed by a significant price movement upwards. Similarly, the spike in social volume is an indicator of high volatility and massive bullish action.
Litecoin social volume chart
 [06.55.04, 23 Oct, 2020]-637390231628839469.png)
On the other hand, it is necessary to keep in mind that increased mentions on social media platforms don't stay up forever. Eventually, investors start selling the news as social volume dwindles just as depicted on the above chart, adding to the selling pressure.
Looking at the other side of the picture
It is worth mentioning that Litecoin has room for growth until it hits the intense selling pressure at $60. Perhaps the approach to $60 could attract buyers into the market again and complete the leg up to $65. Moreover, support at $52 is likely to shift focus to $60 and $65, placing LTC in an upward trajectory.
Author

John Isige
FXStreet
John Isige is a seasoned cryptocurrency journalist and markets analyst committed to delivering high-quality, actionable insights tailored to traders, investors, and crypto enthusiasts. He enjoys deep dives into emerging Web3 tren


