Top 3 Gainers: LINK, OMG, and THETA spike 10% over the past 24 hours thanks to PayPal
- PayPal announced the support of cryptocurrencies to buy things from the 26 million sellers accepted.
- The entire crypto market had a mini bull rally after the announcement, with LINK, OMG, and THETA as the top gainers.

The cryptocurrency market saw a $20 billion increase in its total market capitalization in the past 24 hours. It is only $6 billion away from the 2020-high on September 1 at $391 billion total. LINK and OMG both had a 10% price spike, while THETA is at 11%.
LINK defends the daily uptrend
It seemed that LINK was shifting towards a bearish outlook after forming a lower low at $9.78 compared to the previous low at $10.26. However, thanks to the current 10% price move, bulls were able to rebound and nullify the last low.
LINK/USD daily chart
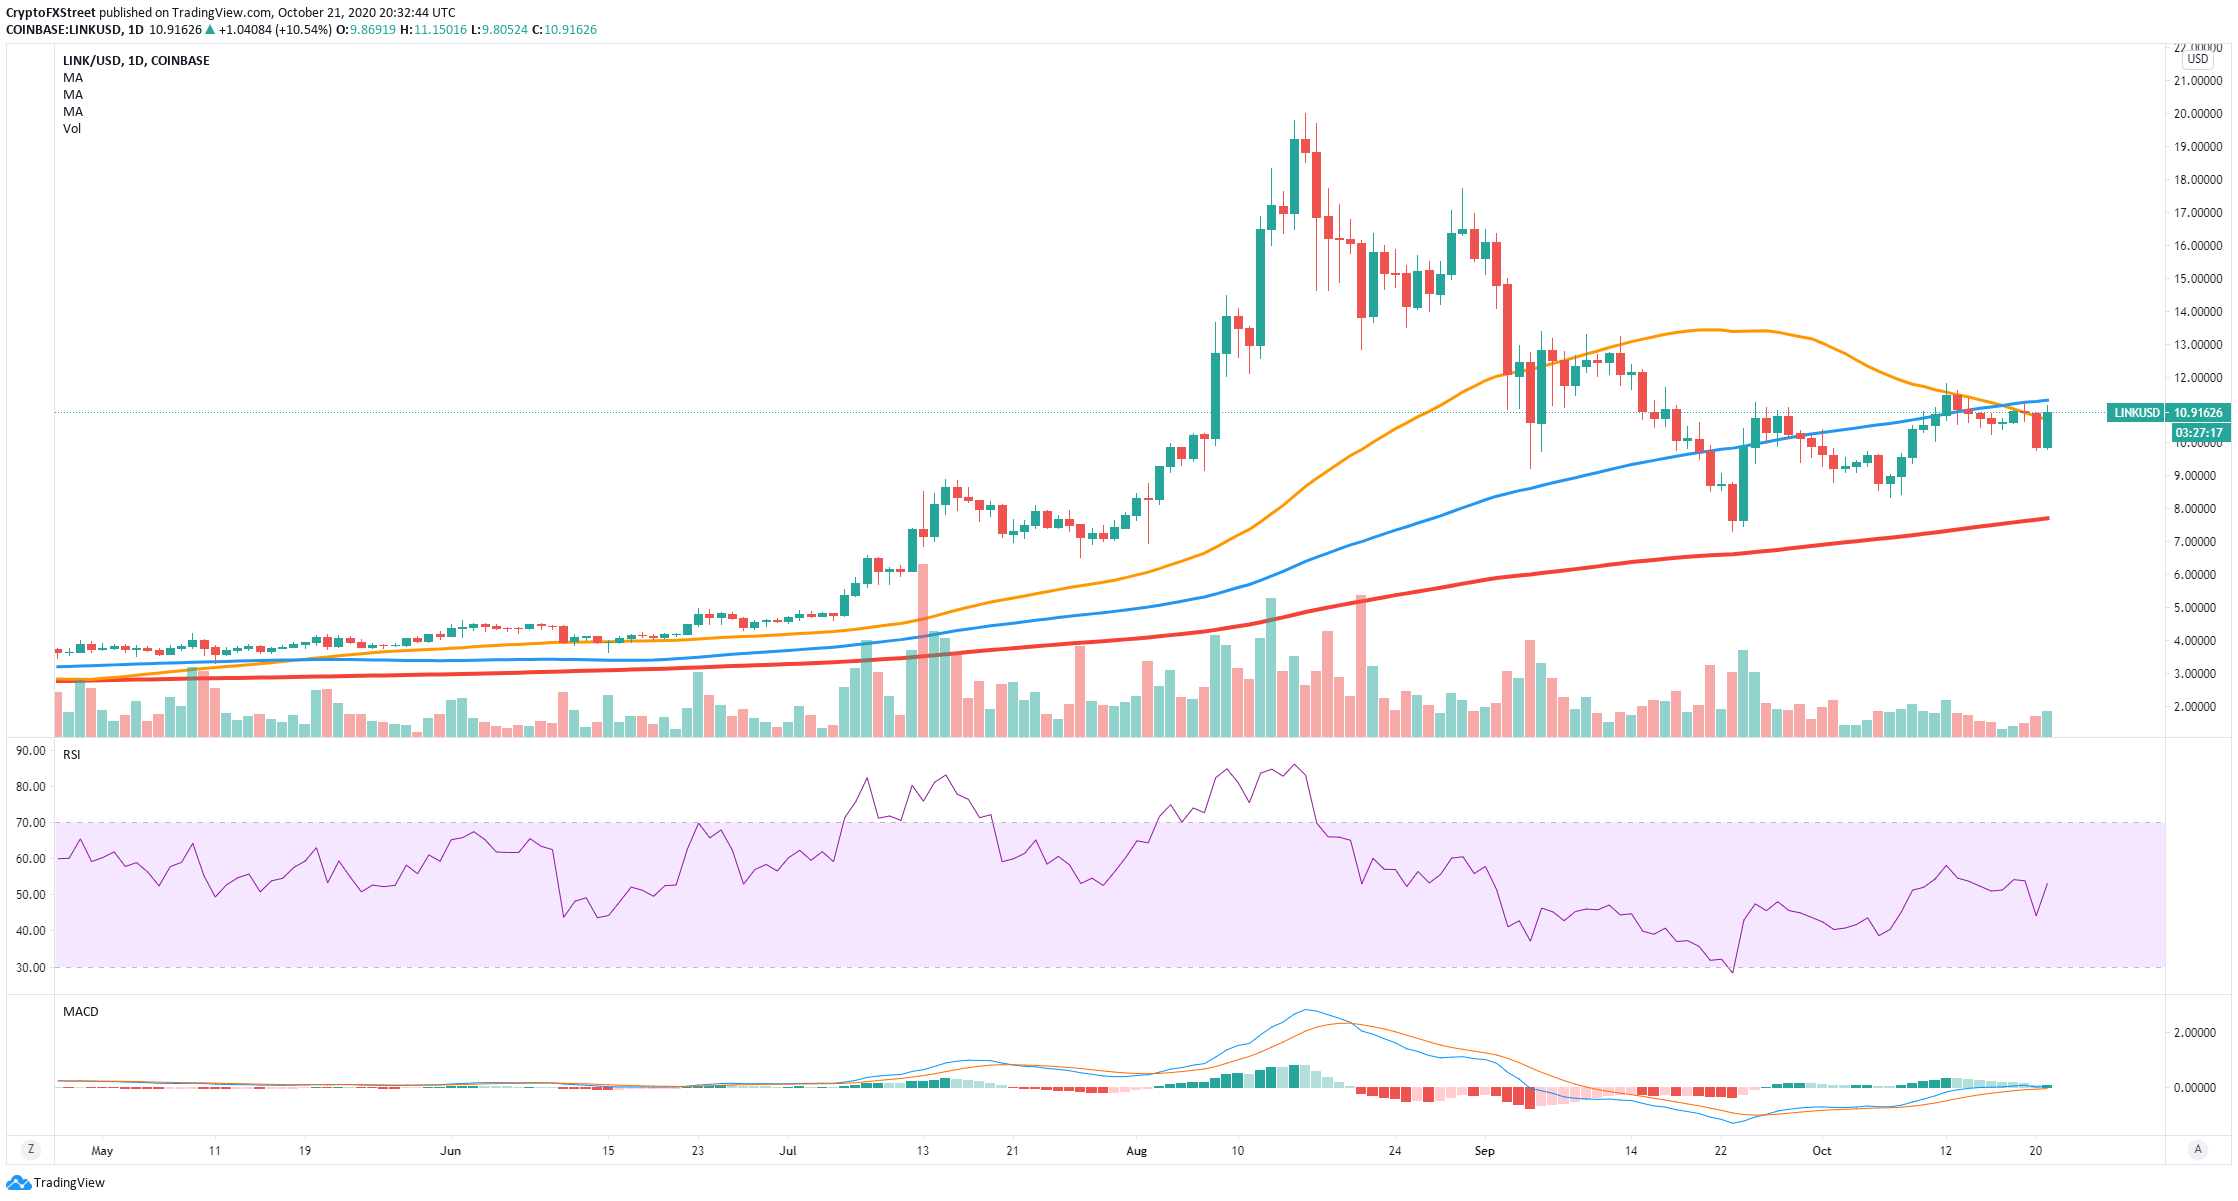
On the daily chart, the price of LINK has climbed above the 50-SMA again after losing it on October 20. The MACD was on the verge of crossing bearishly but it’s gaining strength now. The only real resistance level to the upside is established at $11.81.
LINK IOMAP Chart
-637389102943883515.png)
Looking at the In/Out of the Money Around Price chart, we can actually observe that resistance areas above $10.91 are notably weaker than the support below $10.89. The most significant resistance area is between $11.88 and $12.21 with 5.6 million LINK in volume. That means that a breakout above $12.21 can easily send LINK to $13.
LINK/USD 4-hour chart
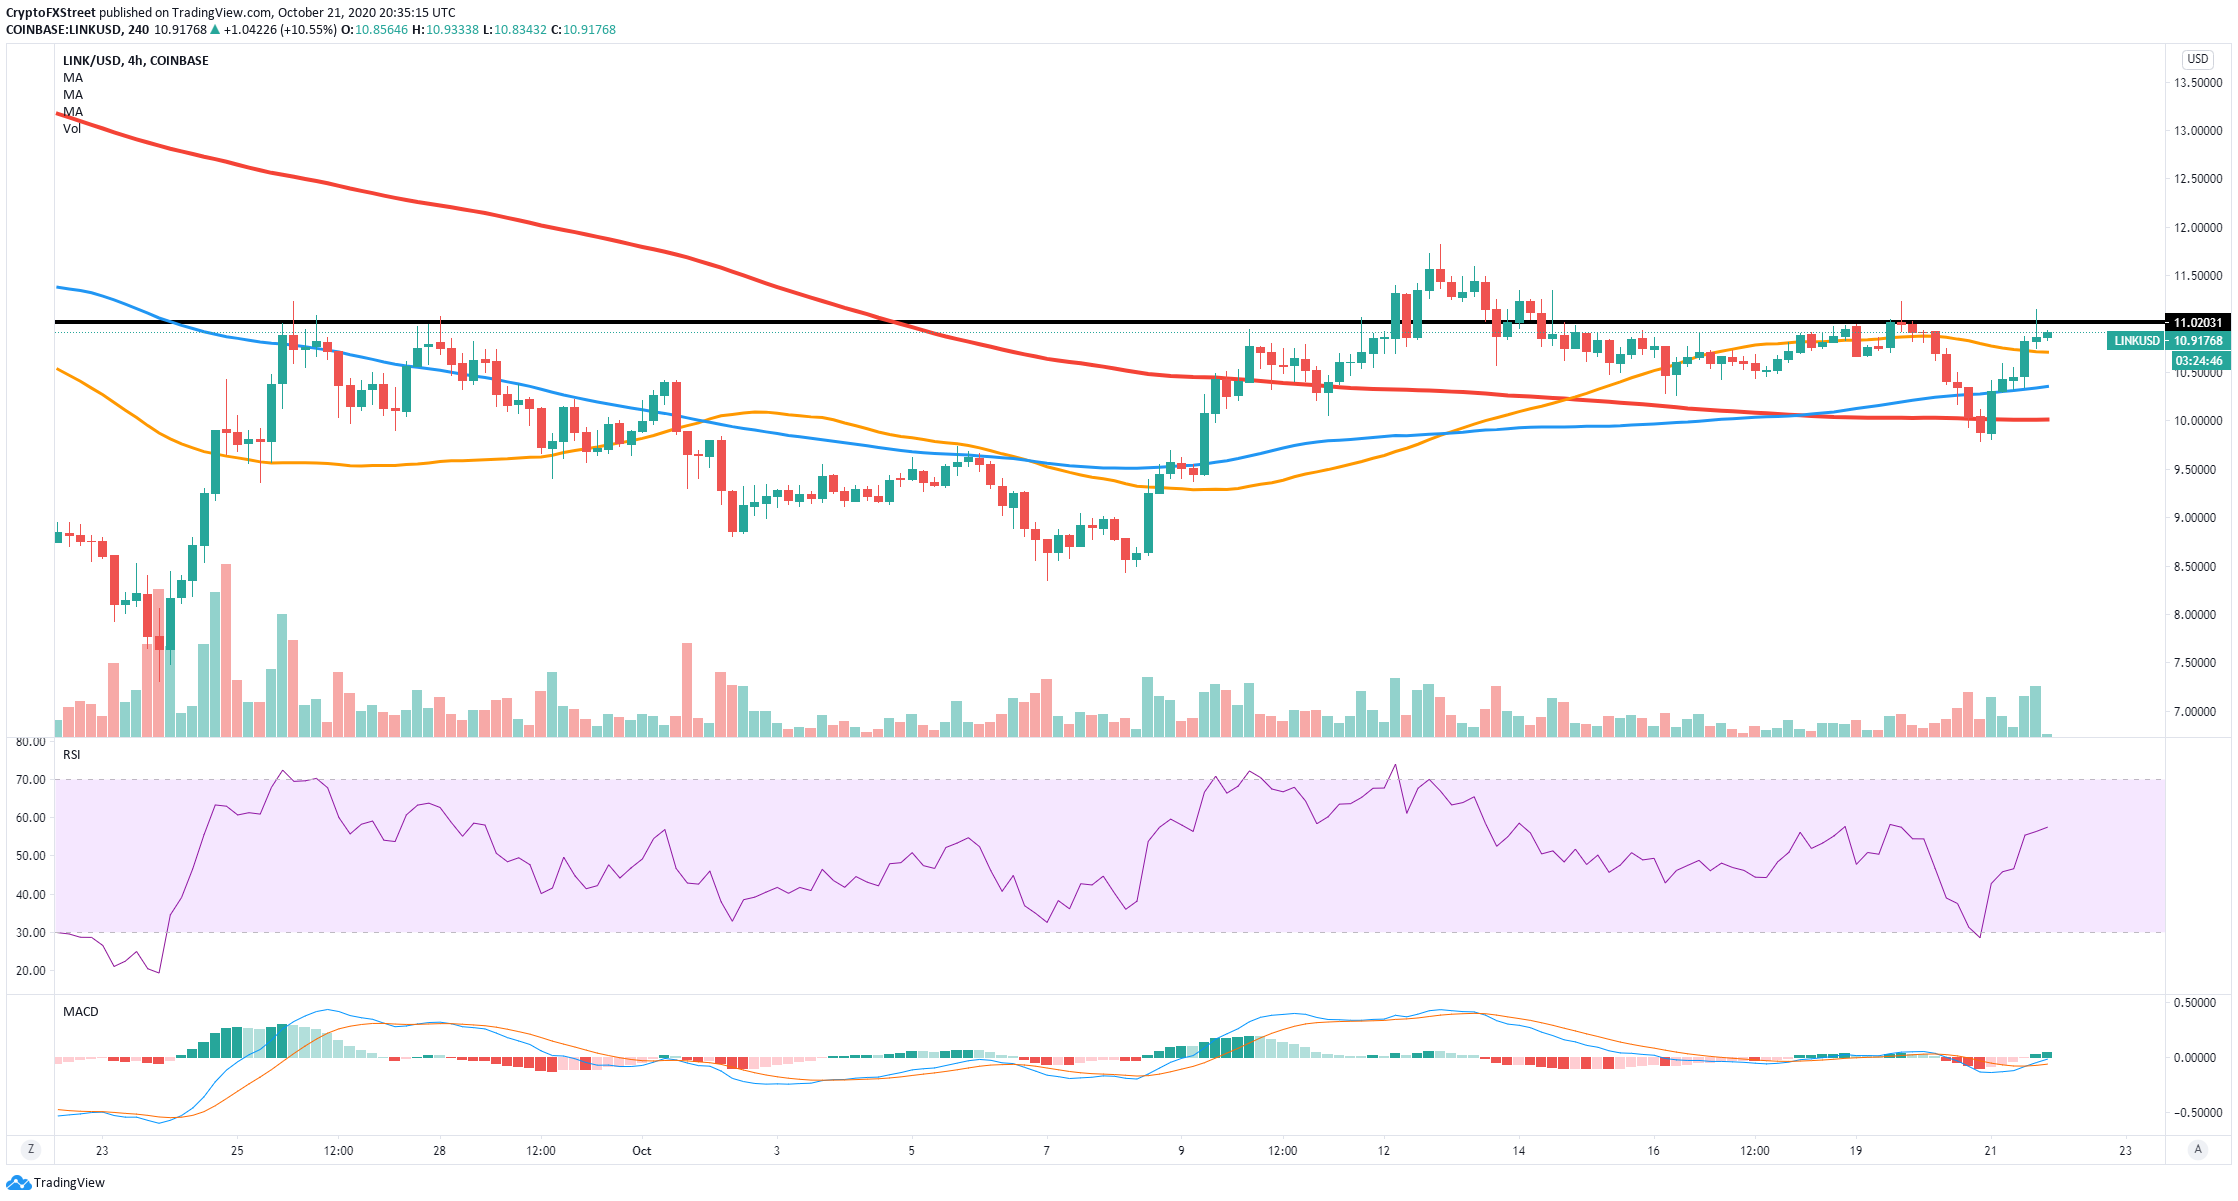
On the 4-hour chart, there is a technical resistance level at $11.02 which could pose a threat for the bulls in the short-term. Rejection from this level can send LINK down to $10.7 at the 50-SMA and even $10.4 where the 100-SMA is currently established.
OMG on the verge of a massive breakout
OMG has been trading inside a symmetrical triangle formed on the daily chart. The latest 10% move pushed the digital asset towards the upper boundary of the channel at around $3.4 but didn’t break out just yet.
OMG/USD daily chart
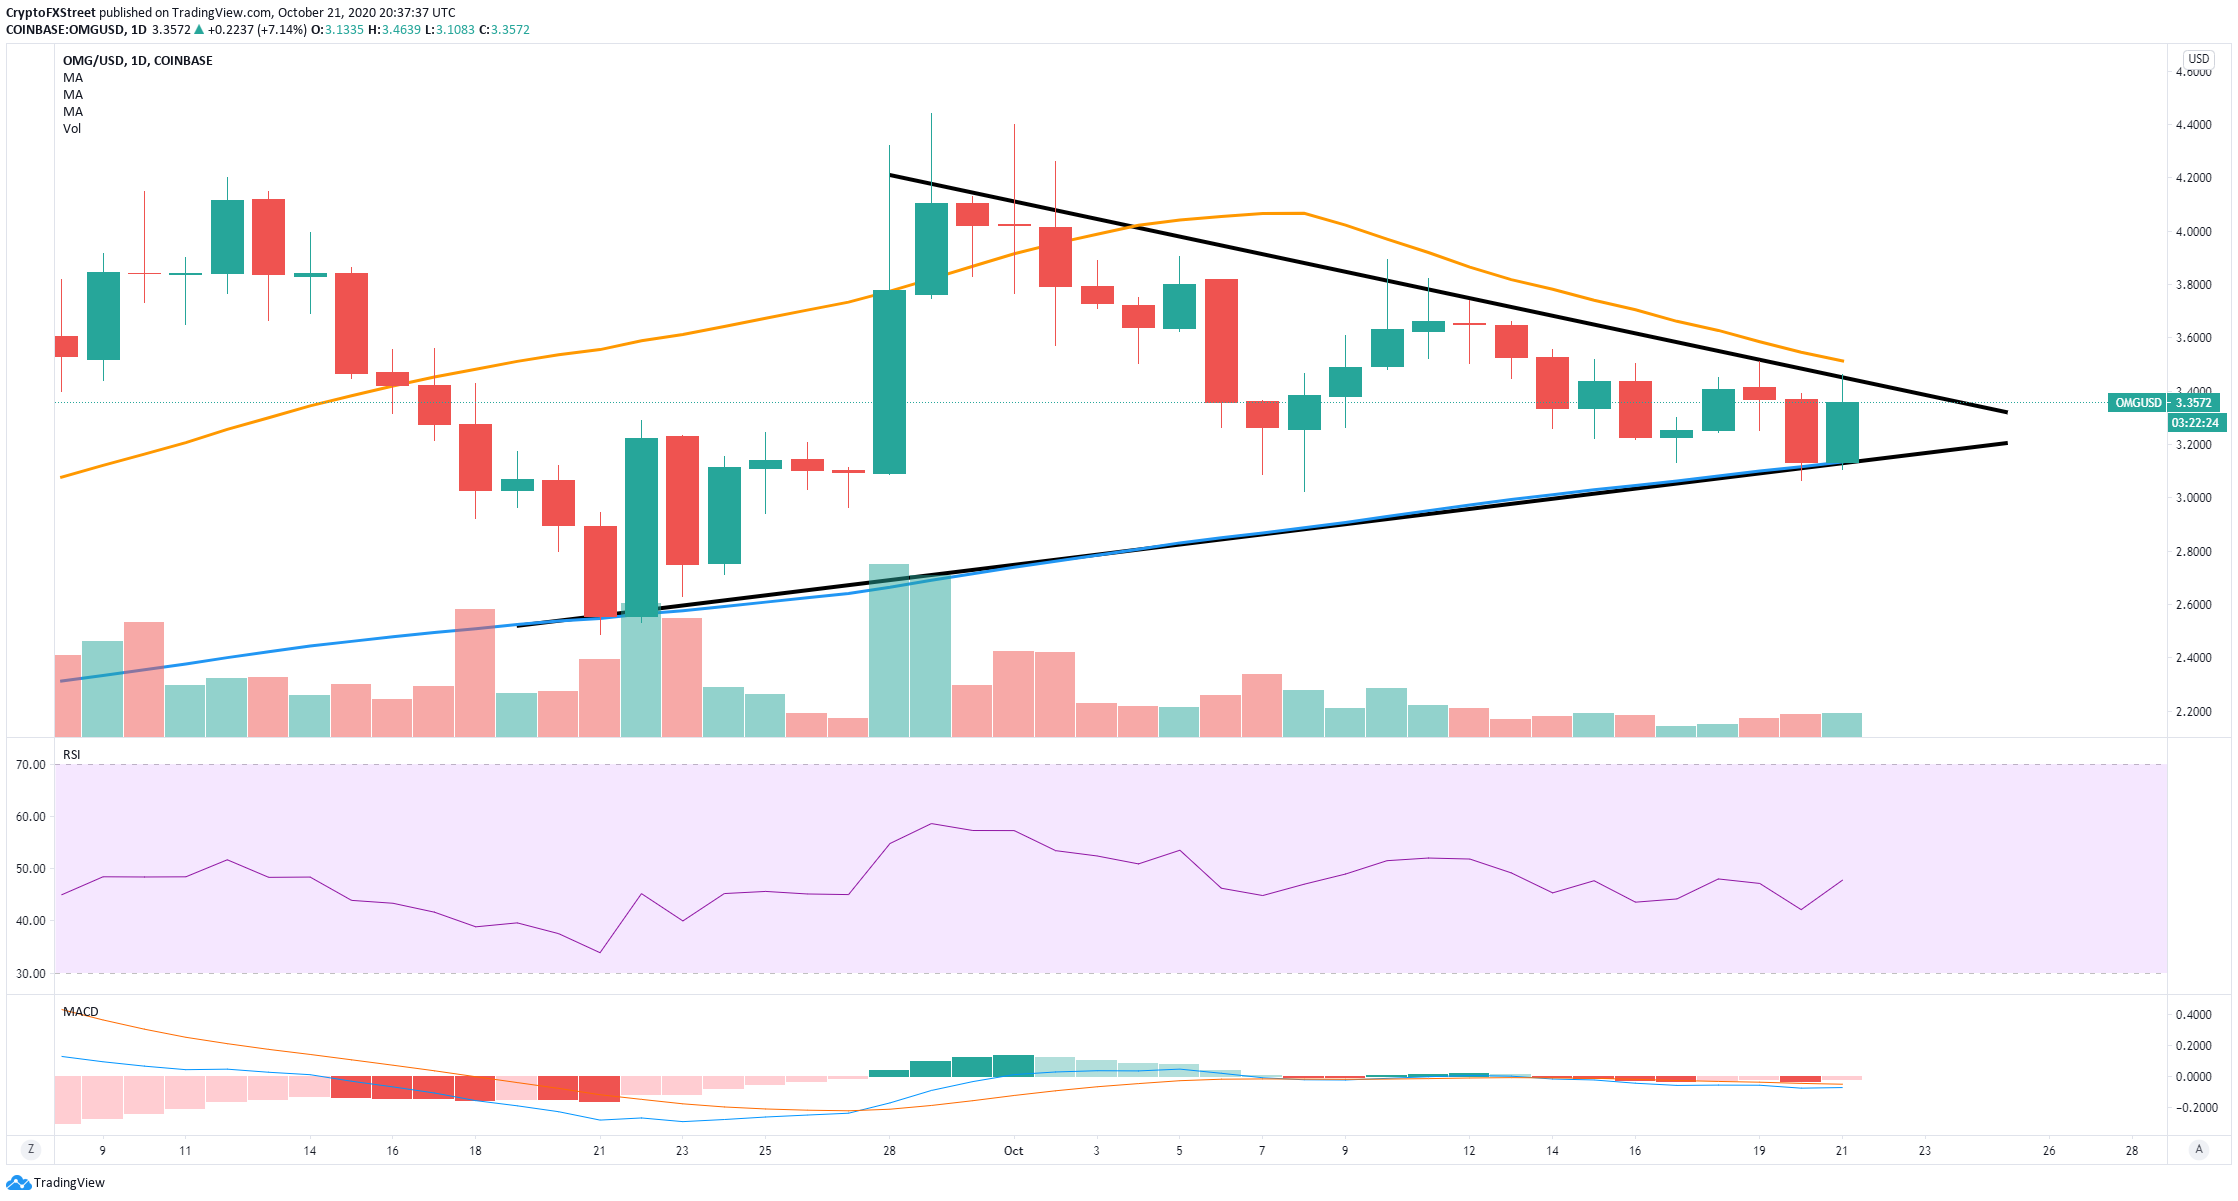
The MACD on the daily chart is on the cusp of turning bullish after the renewed positive sentiment, however, the major resistance level at $3.4 remains as the most crucial point for the bulls. A breakout above this level which coincides with the 50-SMA can send OMG towards the high of $4.5.
OMG/USD 4-hour chart
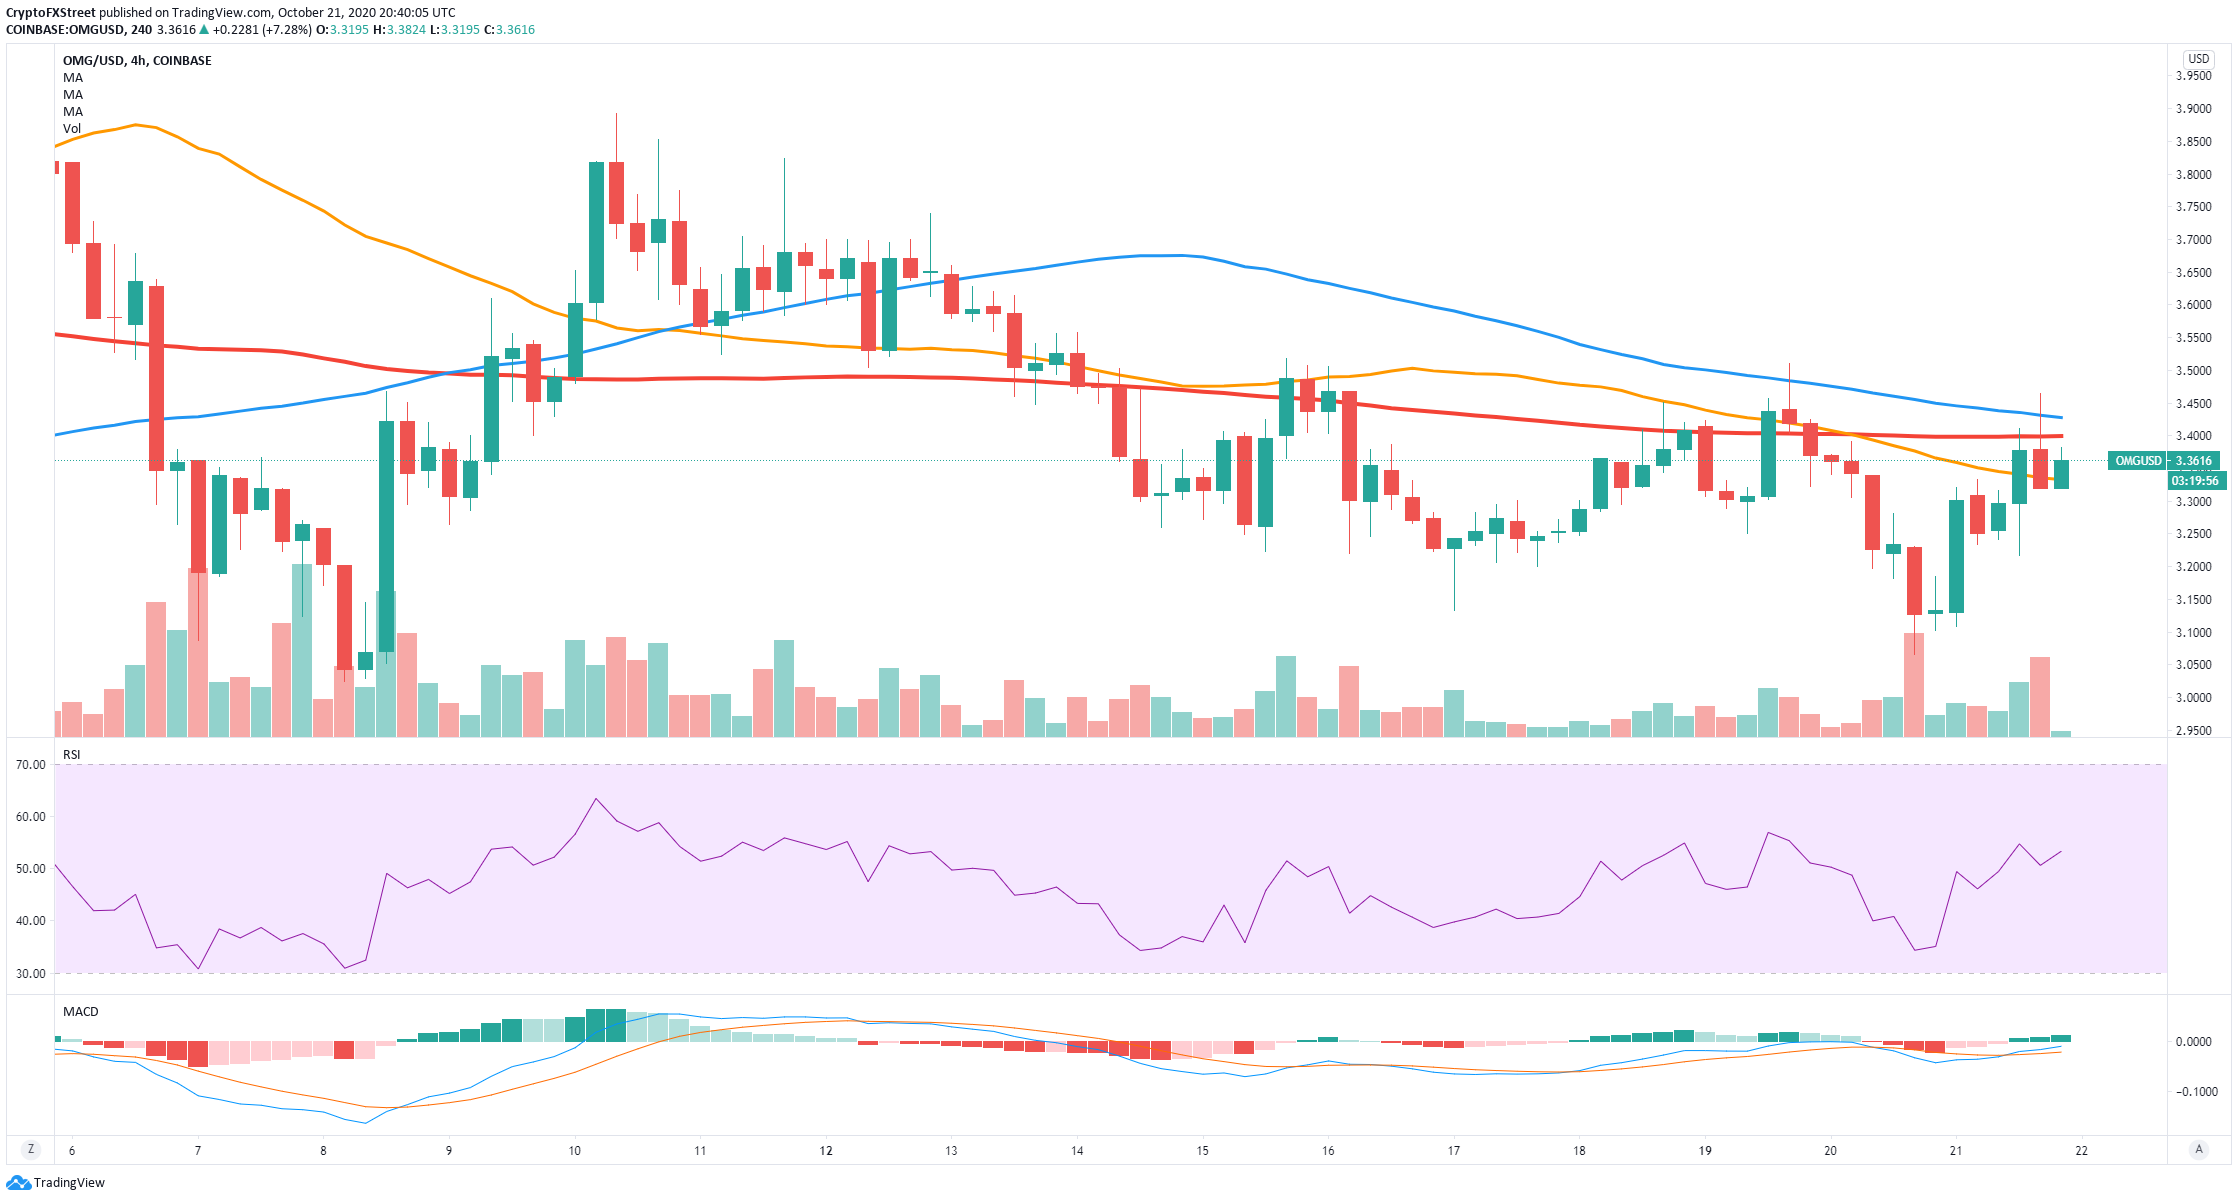
Despite the recent 10% price move, the digital asset is still facing many resistance levels on the way up. The 200-SMA at $3.4 and the 100-SMA at $3.43 are stopping OMG from confirming a 4-hour uptrend.
OMG IOMAP Chart
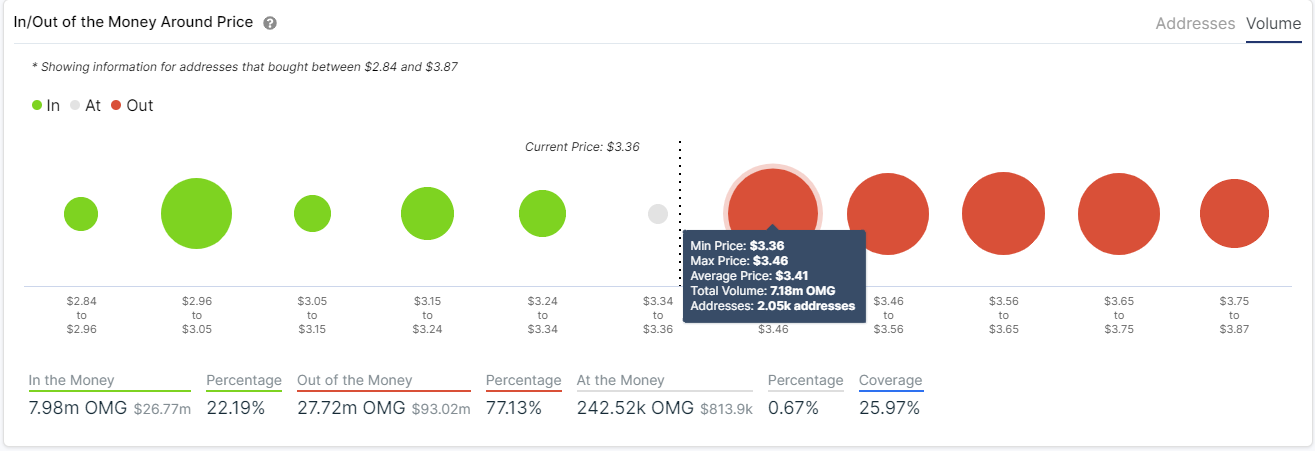
On top of that, the IOMAP chart shows a massive cluster of resistance to the upside compared to support. The huge area between $3.36 and $3.87 is a colossal resistance area. Rejection from $3.36 can drive the price of OMG down to the next significant support area at $3.05.
THETA defends critical support level
THETA has been in a downtrend for the past three weeks but has managed to defend a crucial support level at the 50-SMA on the daily chart located at $0.62. The digital asset is up by more than 2,000% this year.
THETA/USD daily chart
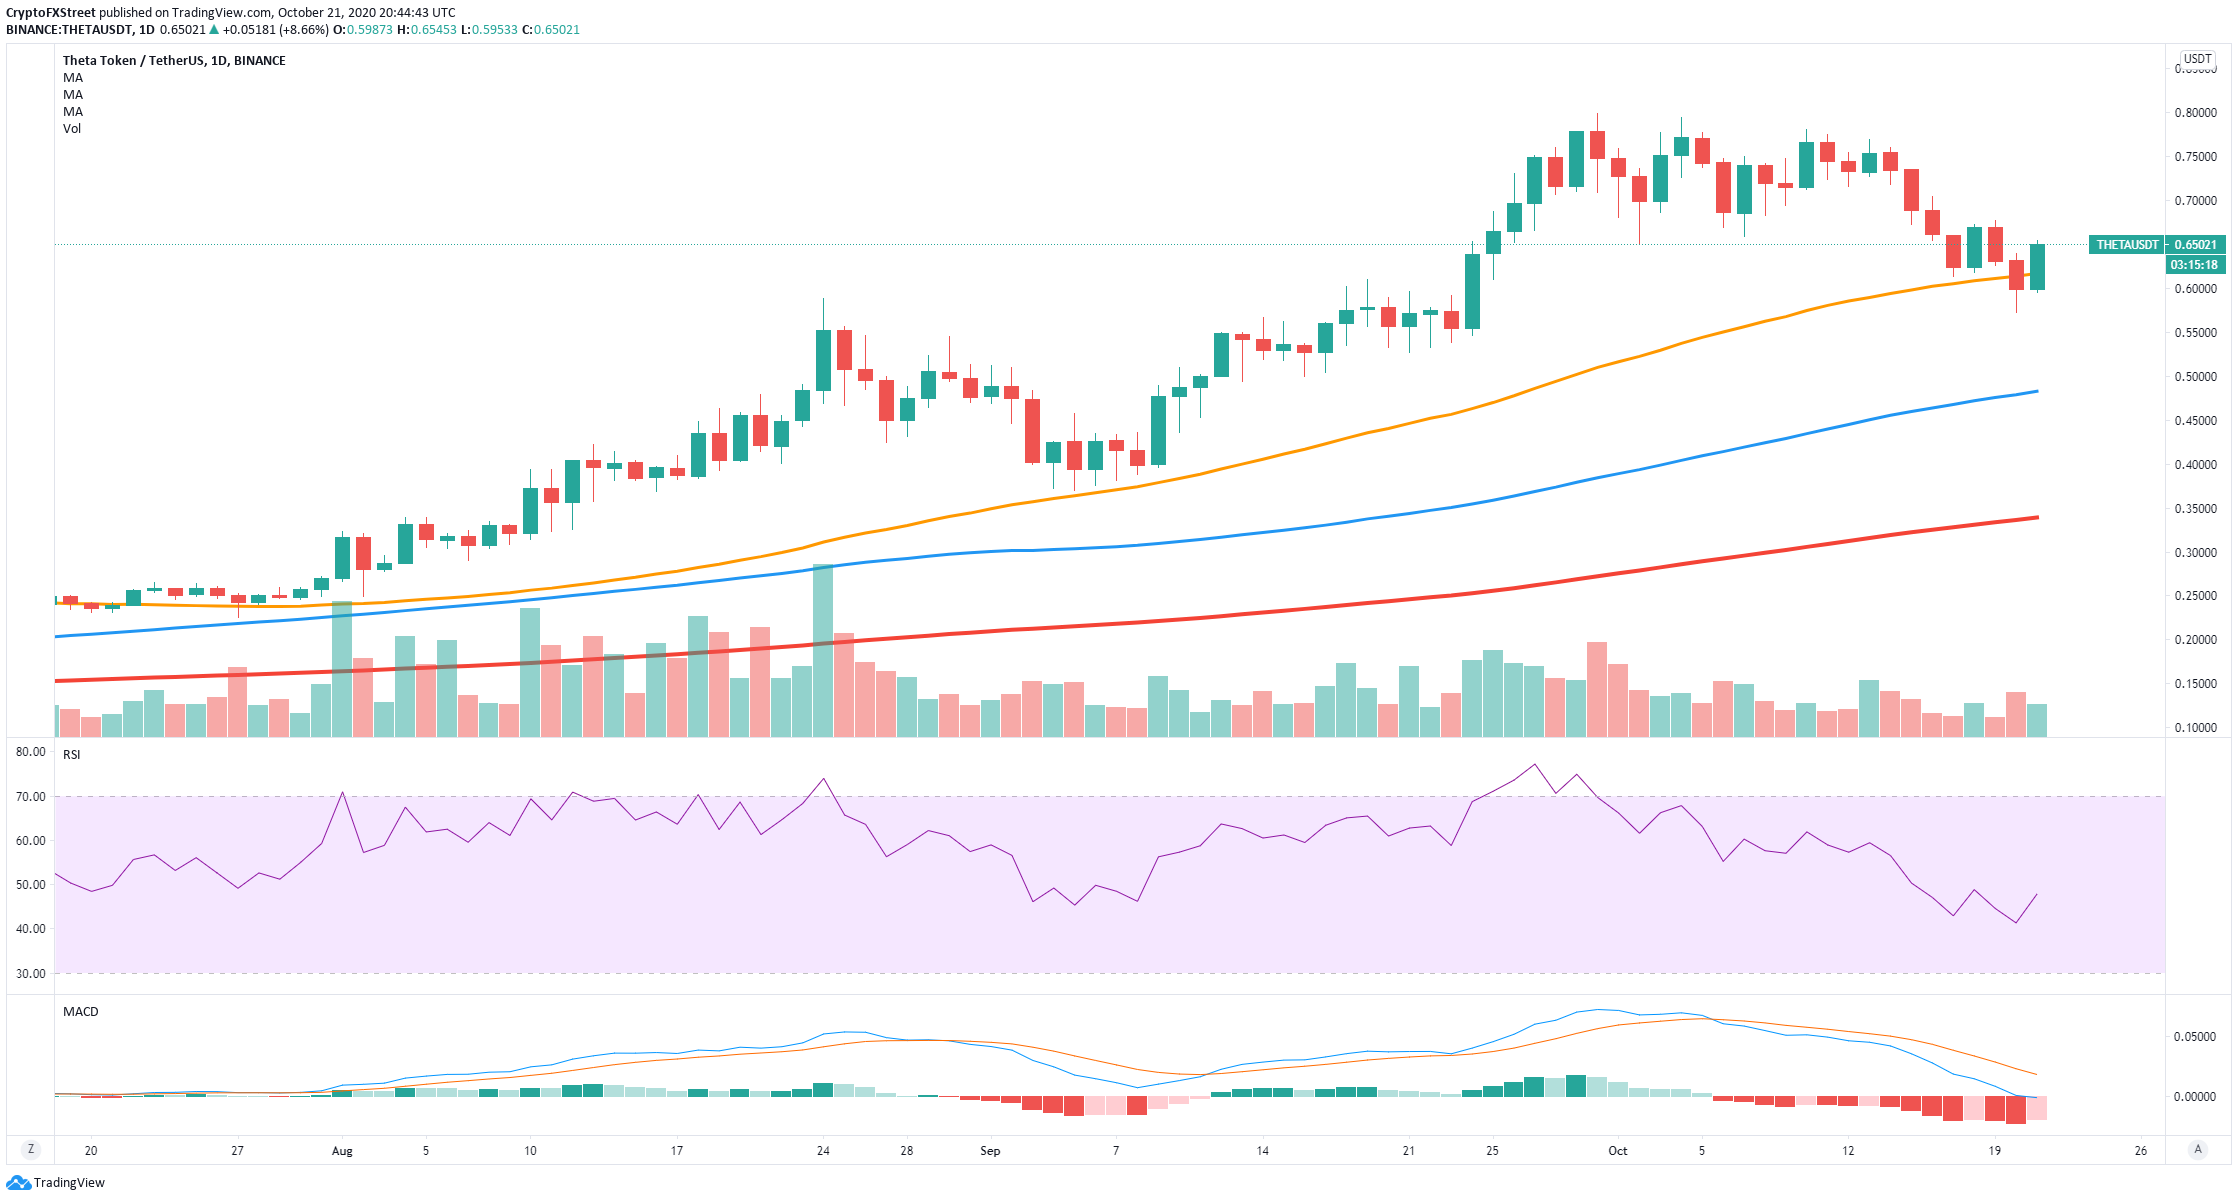
The bounce from the 50-SMA has the potential to push THETA up to the last high at $0.80 in the short-term. The RSI is not extended and will not pose any risk to the bulls. The digital asset has plenty of support to the downside thanks to the three SMAs.
On the other hand, the daily chart also shows the MACD as bearish and not close to a bullish cross just yet, despite the recent price move. On top of that, it seems that the trading volume for THETA is not increasing with the bull move, something that indicates weakness.
THETA IOMAP Chart
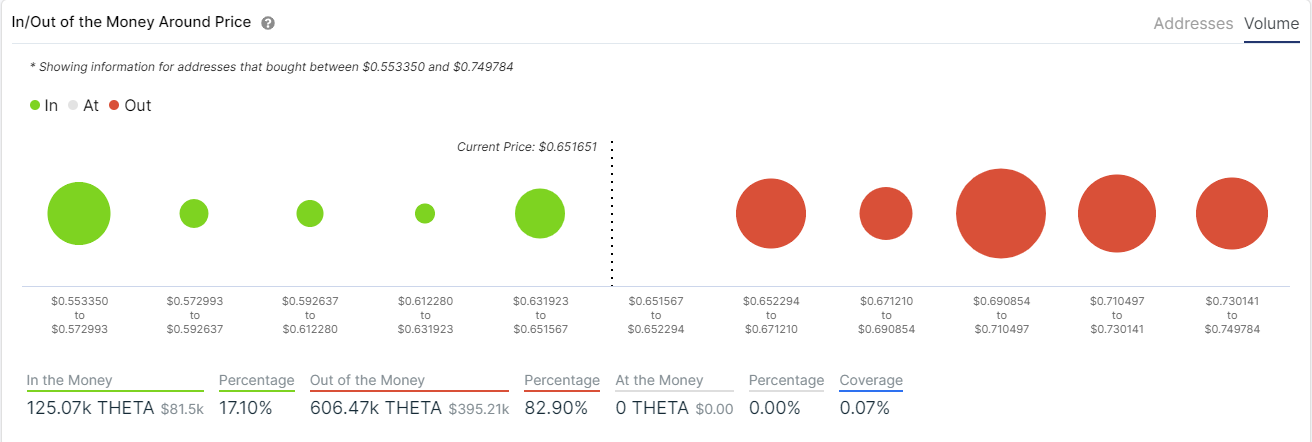
The IOMAP chart shows strong resistance to the upside with the most significant area between $0.69 and $0.71 with 240,000 THETA in volume. On the downside, support is comparatively weaker. A breakout below the 50-SMA can drive THETA down to $0.57.
Critical price points for LINK, OMG, and THETA.
LINK bulls are looking for a breakout above $12.21 which will drive the price towards $13. OMG needs to crack $3.4 to see a move towards a high of $4.5. On the other hand, THETA has defended a critical support level and it’s eying up $0.80 as the potential next price target.
On the bearish side, it seems that LINK needs to hold the above $11.02 to avoid slipping to $10.7 and potentially down to $10.4. For OMG, rejection from $3.36 can drive its price to $3.05. THETA bears are waiting for a breakout below the 50-SMA at $0.62 to push the price down to $0.57.
Author

Lorenzo Stroe
Independent Analyst
Lorenzo is an experienced Technical Analyst and Content Writer who has been working in the cryptocurrency industry since 2012. He also has a passion for trading.




