Litecoin Price Prediction: LTC shows severe signs of a potential reversal
- Litecoin is currently trading at $50 after hitting a crucial resistance level.
- Several indicators are showing LTC is poised for a short-term pullback.

Litecoin had an excellent recovery from the low at $41.64 formed on September 21. The digital asset climbed 23% towards $51 and now faces strong resistance ahead. Over the past week, LTC has seen a notable increase in market capitalization from $3 billion to a peak of $3.35 billion on October 11.
Numerous indicators are in favor of Litecoin bears
Litecoin is currently trading at $50, right below a critical resistance level in the form of the 100-SMA on the daily chart. The TD sequential indicator has just presented a sell signal at this level, which hasn’t been validated just yet. Let's take a look at the daily chart for LTC.
LTC/USD daily chart

On the way down, bulls find the 50-SMA, which will act as a support level in the short-term. Validation of the sell signal into a bearish breakout of the 50-SMA has the potential to drop the price of Litecoin down to the 200-SMA at $47, which should act as a support level.
LTC/USD 12-hour chart
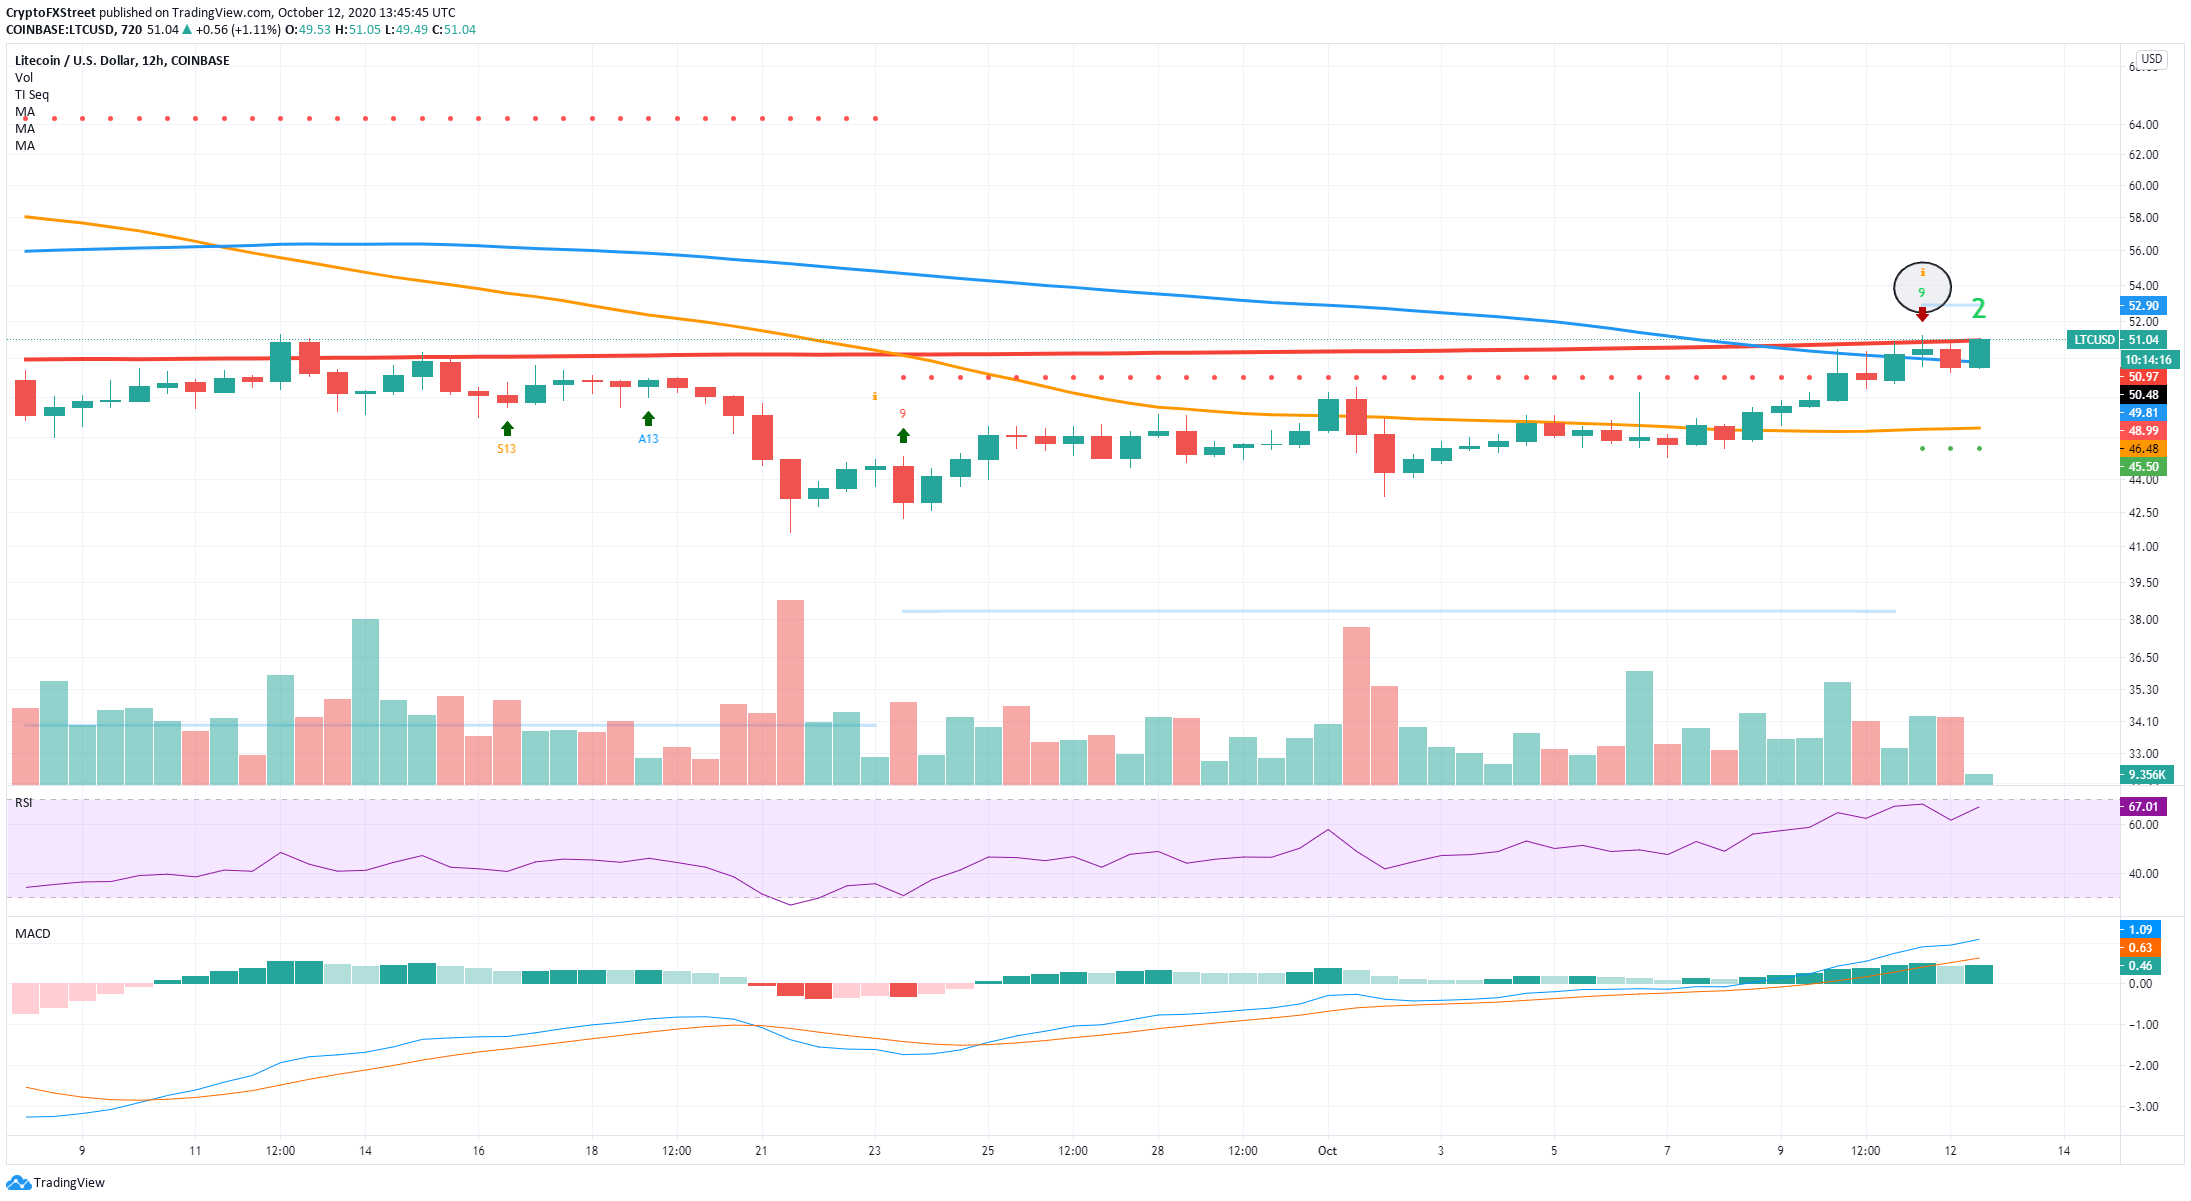
Furthermore, on the 12-hour chart, the TD sequential indicator also presented a sell signal, and the price is getting rejected from the 200-SMA while trying to defend the 100-SMA. The 12-hour chart shows a potential bearish target of $46, where the 50-SMA is established.
LTC New Addresses Chart

On top of that, the chart with new addresses joining the Litecoin network is showing a concerning trend. The number peaked at 71,830 per day on September 24 but has been declining ever since to a current low of 54,300, indicating that the interest in the digital asset is fading, despite the current bullish momentum.
LTC IOMAP Chart

On the other hand, looking at the In/Out of the Money Around Price chart by IntoTheBlock shows strong support on the way down. The range between $49.4 to $50.8 has 2.55 million LTC in volume, while the resistance area from $51 to $54 only has 1.8 million in volume. Additionally, all the levels below $50 until $43 show similar volumes of LTC bought, which indicates that bulls still have a lot of strength.
LTC/USD 4-hour chart

On the 4-hour chart, LTC faces a resistance level at $51.3 tested a few times in the past on September 12 and September 4. A breakout above this level has the potential to push Litecoin towards $58 and even the $60 psychological level.
Essential points to look out for
Although Litecoin had a strong bullish rally for the past two weeks, the digital asset could be on the verge of a short-term pullback. The most critical support level to look out for is the 50-SMA on the daily chart at $49. A breakout would lead LTC down to $46.
On the flip side, it seems that bulls have established several healthy support levels on the way down. If Litecoin can climb above the resistance level at $51.3 on the 4-hour chart, the price could rise to $58 and even to the psychological level at $60.
Author

Lorenzo Stroe
Independent Analyst
Lorenzo is an experienced Technical Analyst and Content Writer who has been working in the cryptocurrency industry since 2012. He also has a passion for trading.


