Litecoin Price Prediction: LTC on the verge of a 10% breakdown – Confluence Detector
- Litecoin has lost the ground above $90, adding credibility to the potential freefall to $80.
- A sell signal on the weekly chart suggests that the correction is almost inevitable before LTC rebounds significantly.

Litecoin refreshed the highs above $90 but left $100 untouched. The failure to sustain the uptrend has led to a drop below $90. LTC/USD is teetering at $88 amid bearish signals favoring losses eyeing $80.
Litecoin prints a massive bearish picture
LTC has dived under the ascending parallel channel on the 4-hour chart. The bearish narrative seems to have been validated by the Relative Strength Index after it hit higher levels within the overbought region, followed by a series of lower highs. This bearish divergence hints at a decrease in buying volume and, therefore, the price falling further.
If Litecoin closed the day under the channel’s lower boundary support, sell orders are likely to be triggered, adding weight to the downswing. Tentatively, buyers will try to hold the price at $85, but if the bearish pressure rises significantly, losses might stretch under the 100 SMA. Meanwhile, the 50 SMA at $80 appears to be the most formidable anchor zone.
%20(14)-637426483450568053.png)
LTC/USD 4-hour chart
The TD Sequential indicator has presented a sell signal on the weekly chart. The call to sell manifested in a green nine candlestick. If validated, Litecoin would dive for one to four daily candlesticks. The validation is very likely because most of the previous sell signals materialized. Moreover, LTC could embark on a lengthy downtrend, perhaps retest the support at $64.
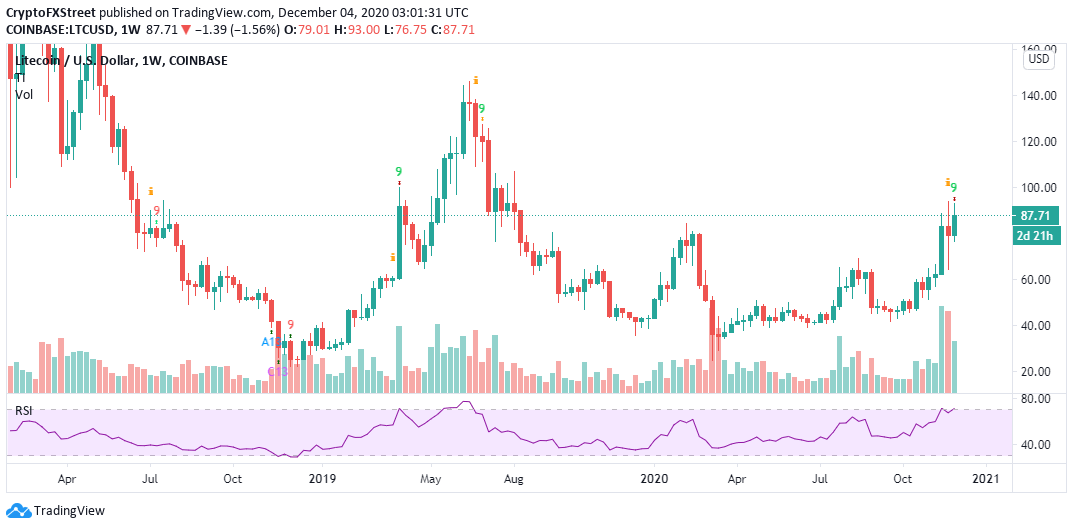
LTC/USD weekly chart
The confluence detector tool reveals a robust support area for the sixth-largest cryptoasset. Besides, bulls must ensure that the anchor at $87.6, as highlighted by the one-week pivot point resistance one is guarded at all costs to avert losses to $80.
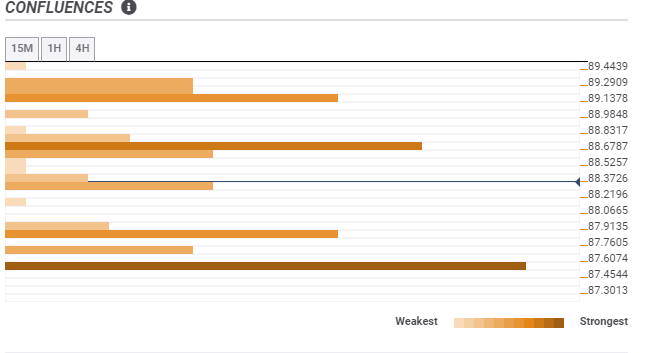
LTC/USD confluence chart
n the upside, the confluence tool shows immense resistance likely to delay recovery. The first hurdle lies at $88.6 and is home to the SMA 50 15-minutes, the 1-hour Bollinger Band middle boundary, and the SMA ten 15-minutes. A second resistance holds the ground at $89, as illustrated by the Fibonacci 38.2% one-day.
The bearish outlook would be abandoned if Litecoin reclaimed the position within the ascending channel. Besides, closing the day above $90 would encourage buyers to rejoin the market from the sidelines. A confirmed breakout towards $100 is likely to boost Litecoin into another magnificent rally.
Author

John Isige
FXStreet
John Isige is a seasoned cryptocurrency journalist and markets analyst committed to delivering high-quality, actionable insights tailored to traders, investors, and crypto enthusiasts. He enjoys deep dives into emerging Web3 tren


