Sui Price Forecast: Sui slips below $1.50 as network demand and risk appetite wane
- Sui is down 1% on Tuesday, extending the 5% loss from Monday, which broke below $1.50.
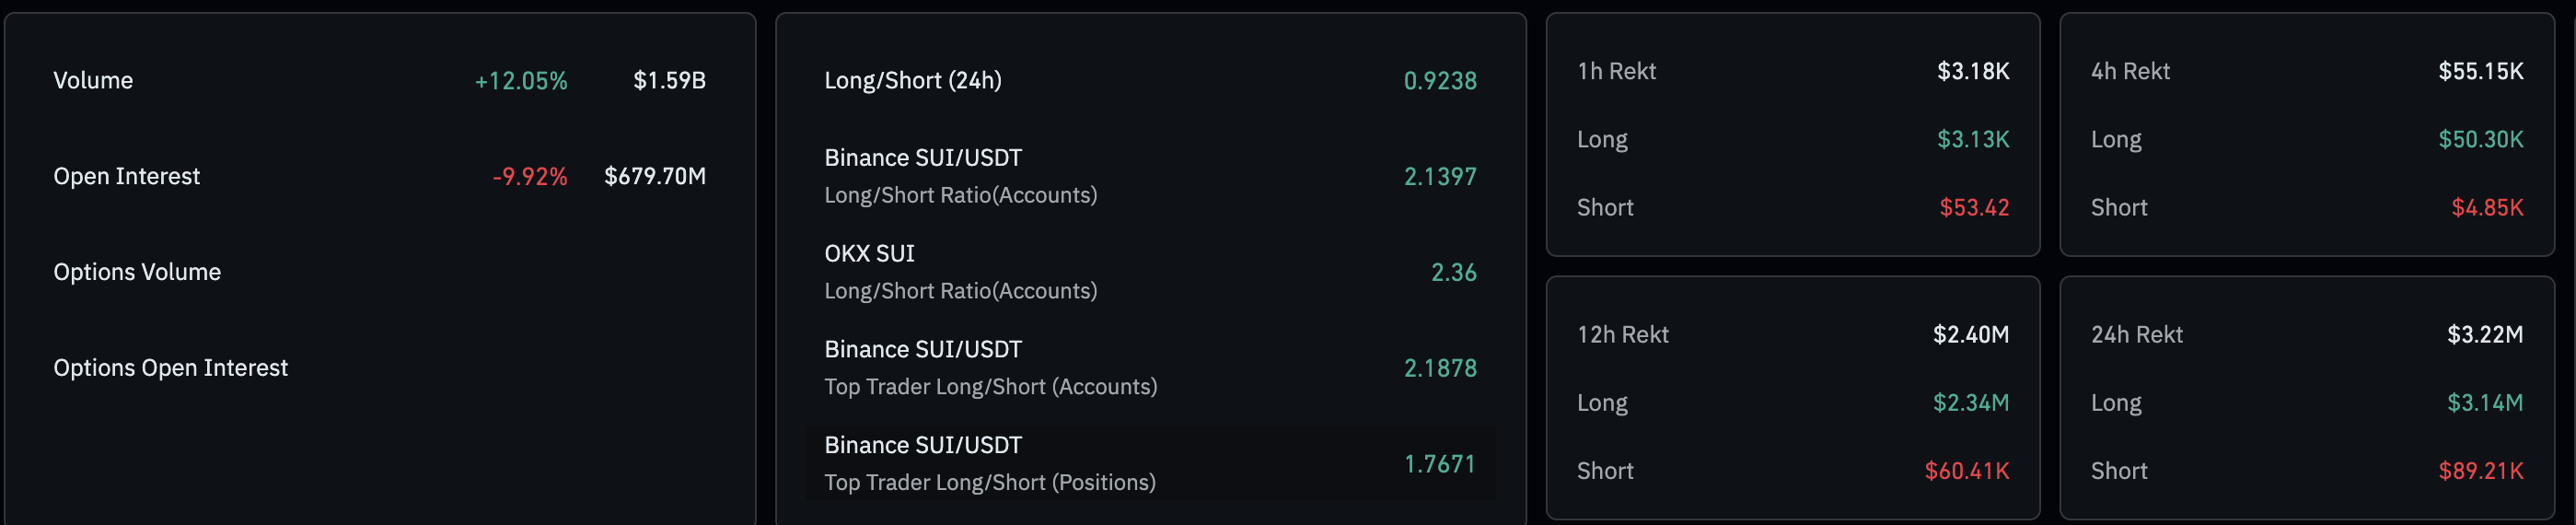
- Derivatives data indicates a loss of traders’ risk appetite as 24-hour long liquidations exceed $3 million.
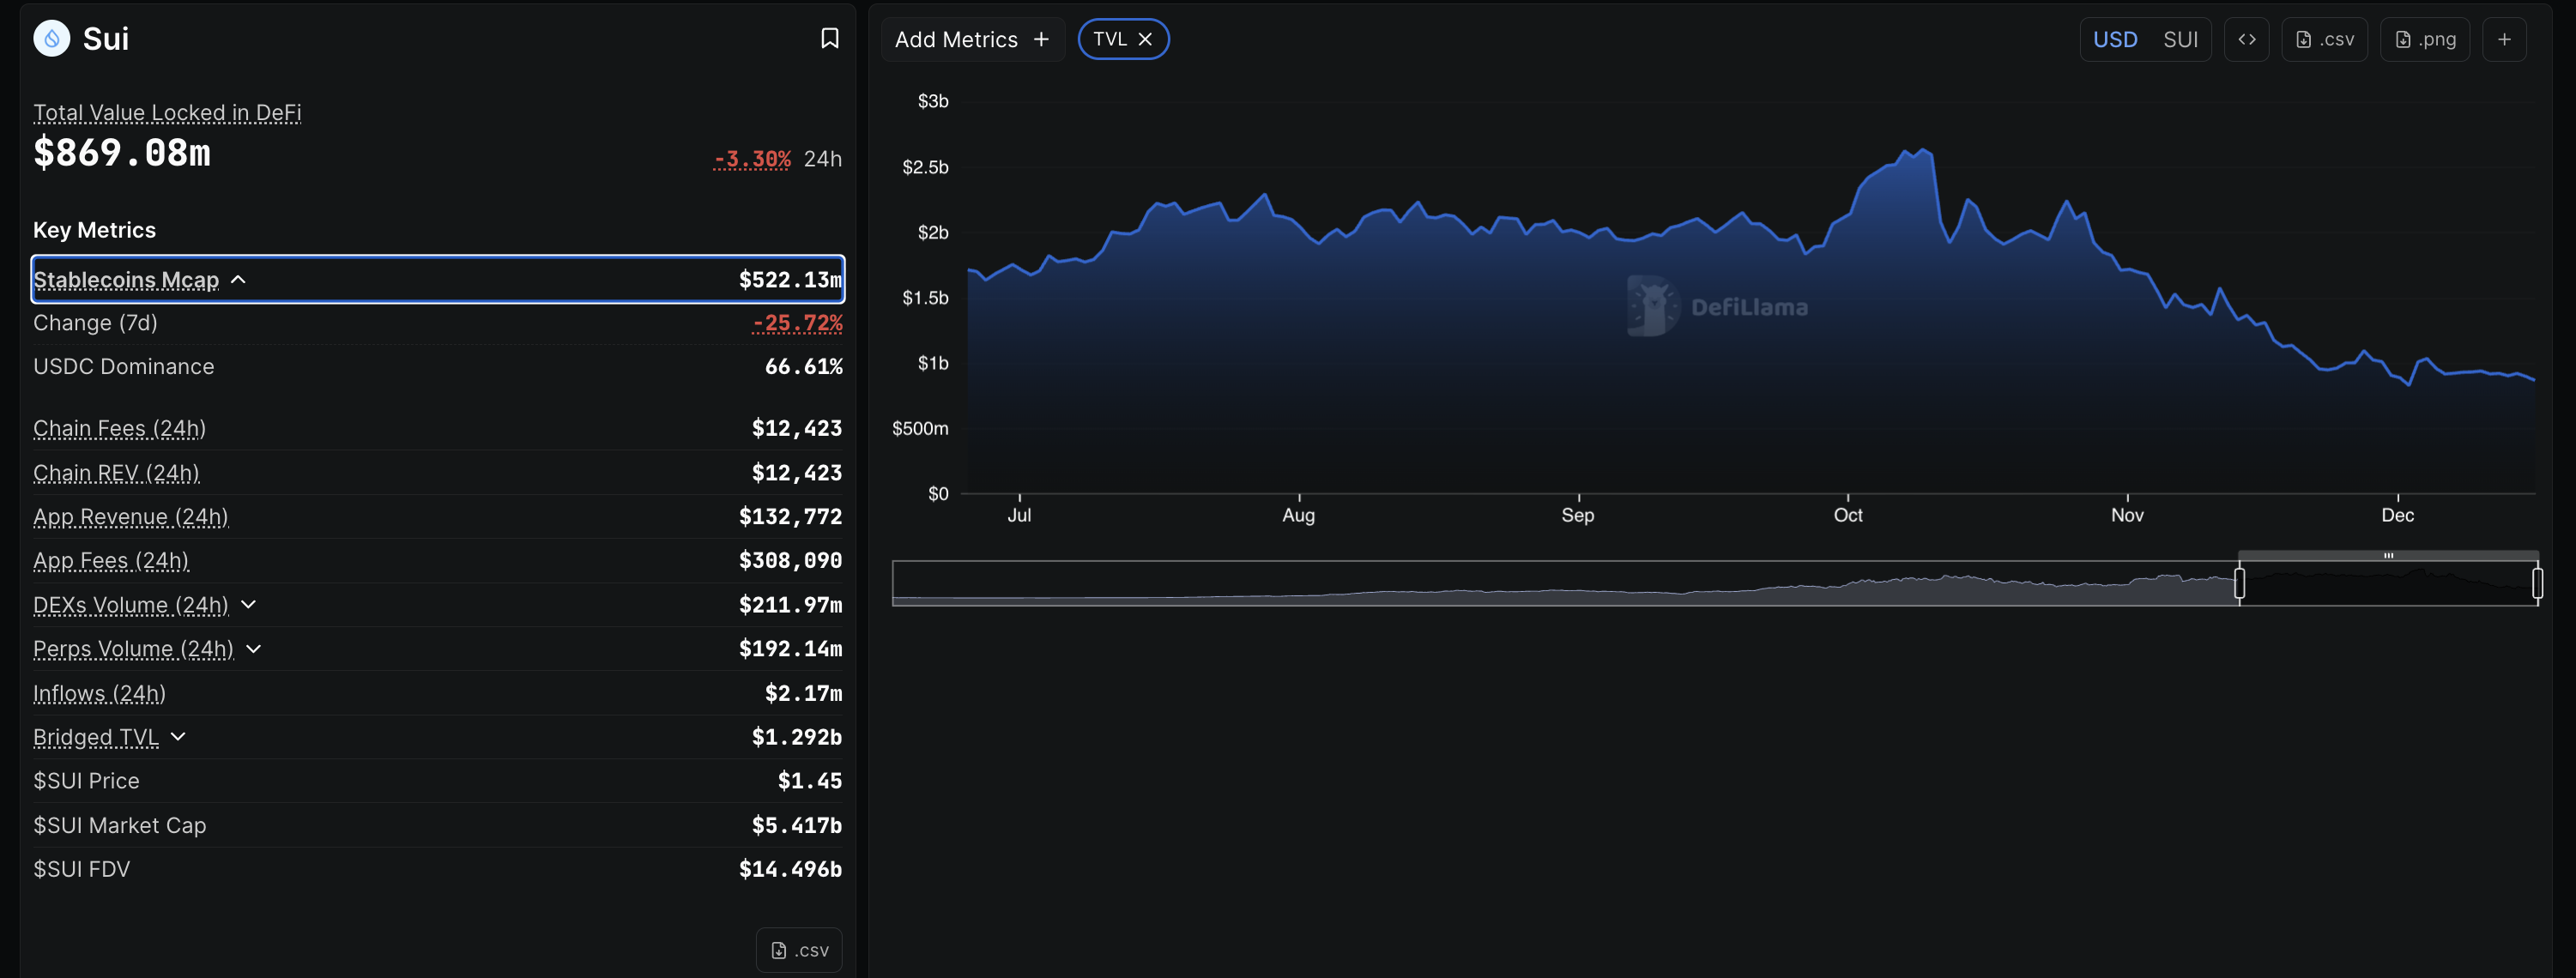
- On-chain data indicates that the network demand is declining as TVL and stablecoin market capitalization slide.

Sui (SUI) remains under intense bearish pressure, extending losses by 1% at press time on Tuesday for the third straight day. The Decentralized Finance (DeFi) token is losing value as on-chain demand falters amid broader market risk-off sentiment and derivatives data signaling lowered risk appetite. The technical outlook for SUI points to $1.39 as the next key support level.
Demand falters across on-chain and retail scale
CoinGlass data shows that retail interest in SUI is down significantly, as its futures Open Interest (OI) has dropped nearly 10% over the last 24 hours to $679.70 million. Typically, a drop in OI reflects risk-off sentiment among traders, as the notional value of all active positions, both long and short, declines.
Meanwhile, the long liquidations in the last 24 hours amount to $3.14 million, outpacing the short liquidations of $89,210, indicating a larger wipeout of bullish-aligned positions. This has reduced the long-to-short ratio to 0.9238, which means a larger number of active short positions.
On the network side, the Sui blockchain is seeing declining demand, with Total Value Locked (TVL) down 3.30% over the last 24 hours to $869.08 million. This indicates that users are cashing out their digital assets.
Along the same lines, liquidity on Sui also takes a hit, as the stablecoin market capitalization is down 25.72% over the last week.
Technical outlook: Will Sui extend the bearish breakout below $1.50?
Sui extends the decline below $1.50 mark after a 5% loss on Monday, which marked the bearish breakout of a descending triangle pattern on the 4-hour chart. At the time of writing, SUI trades below the S1 Pivot Point at $1.47, with the path of least resistance pointing to the S2 Pivot Point at $1.3924.
The momentum indicators on the 4-hour chart support the bearish thesis as selling pressure mounts. The Relative Strength Index (RSI) at 28 trends into the oversold zone, reflecting intense bearish pressure. If RSI consolidates below 30, SUI could experience an extended downtrend.
The Moving Average Convergence Divergence (MACD) extends the decline into negative territory, bolstering the rise in bearish momentum.
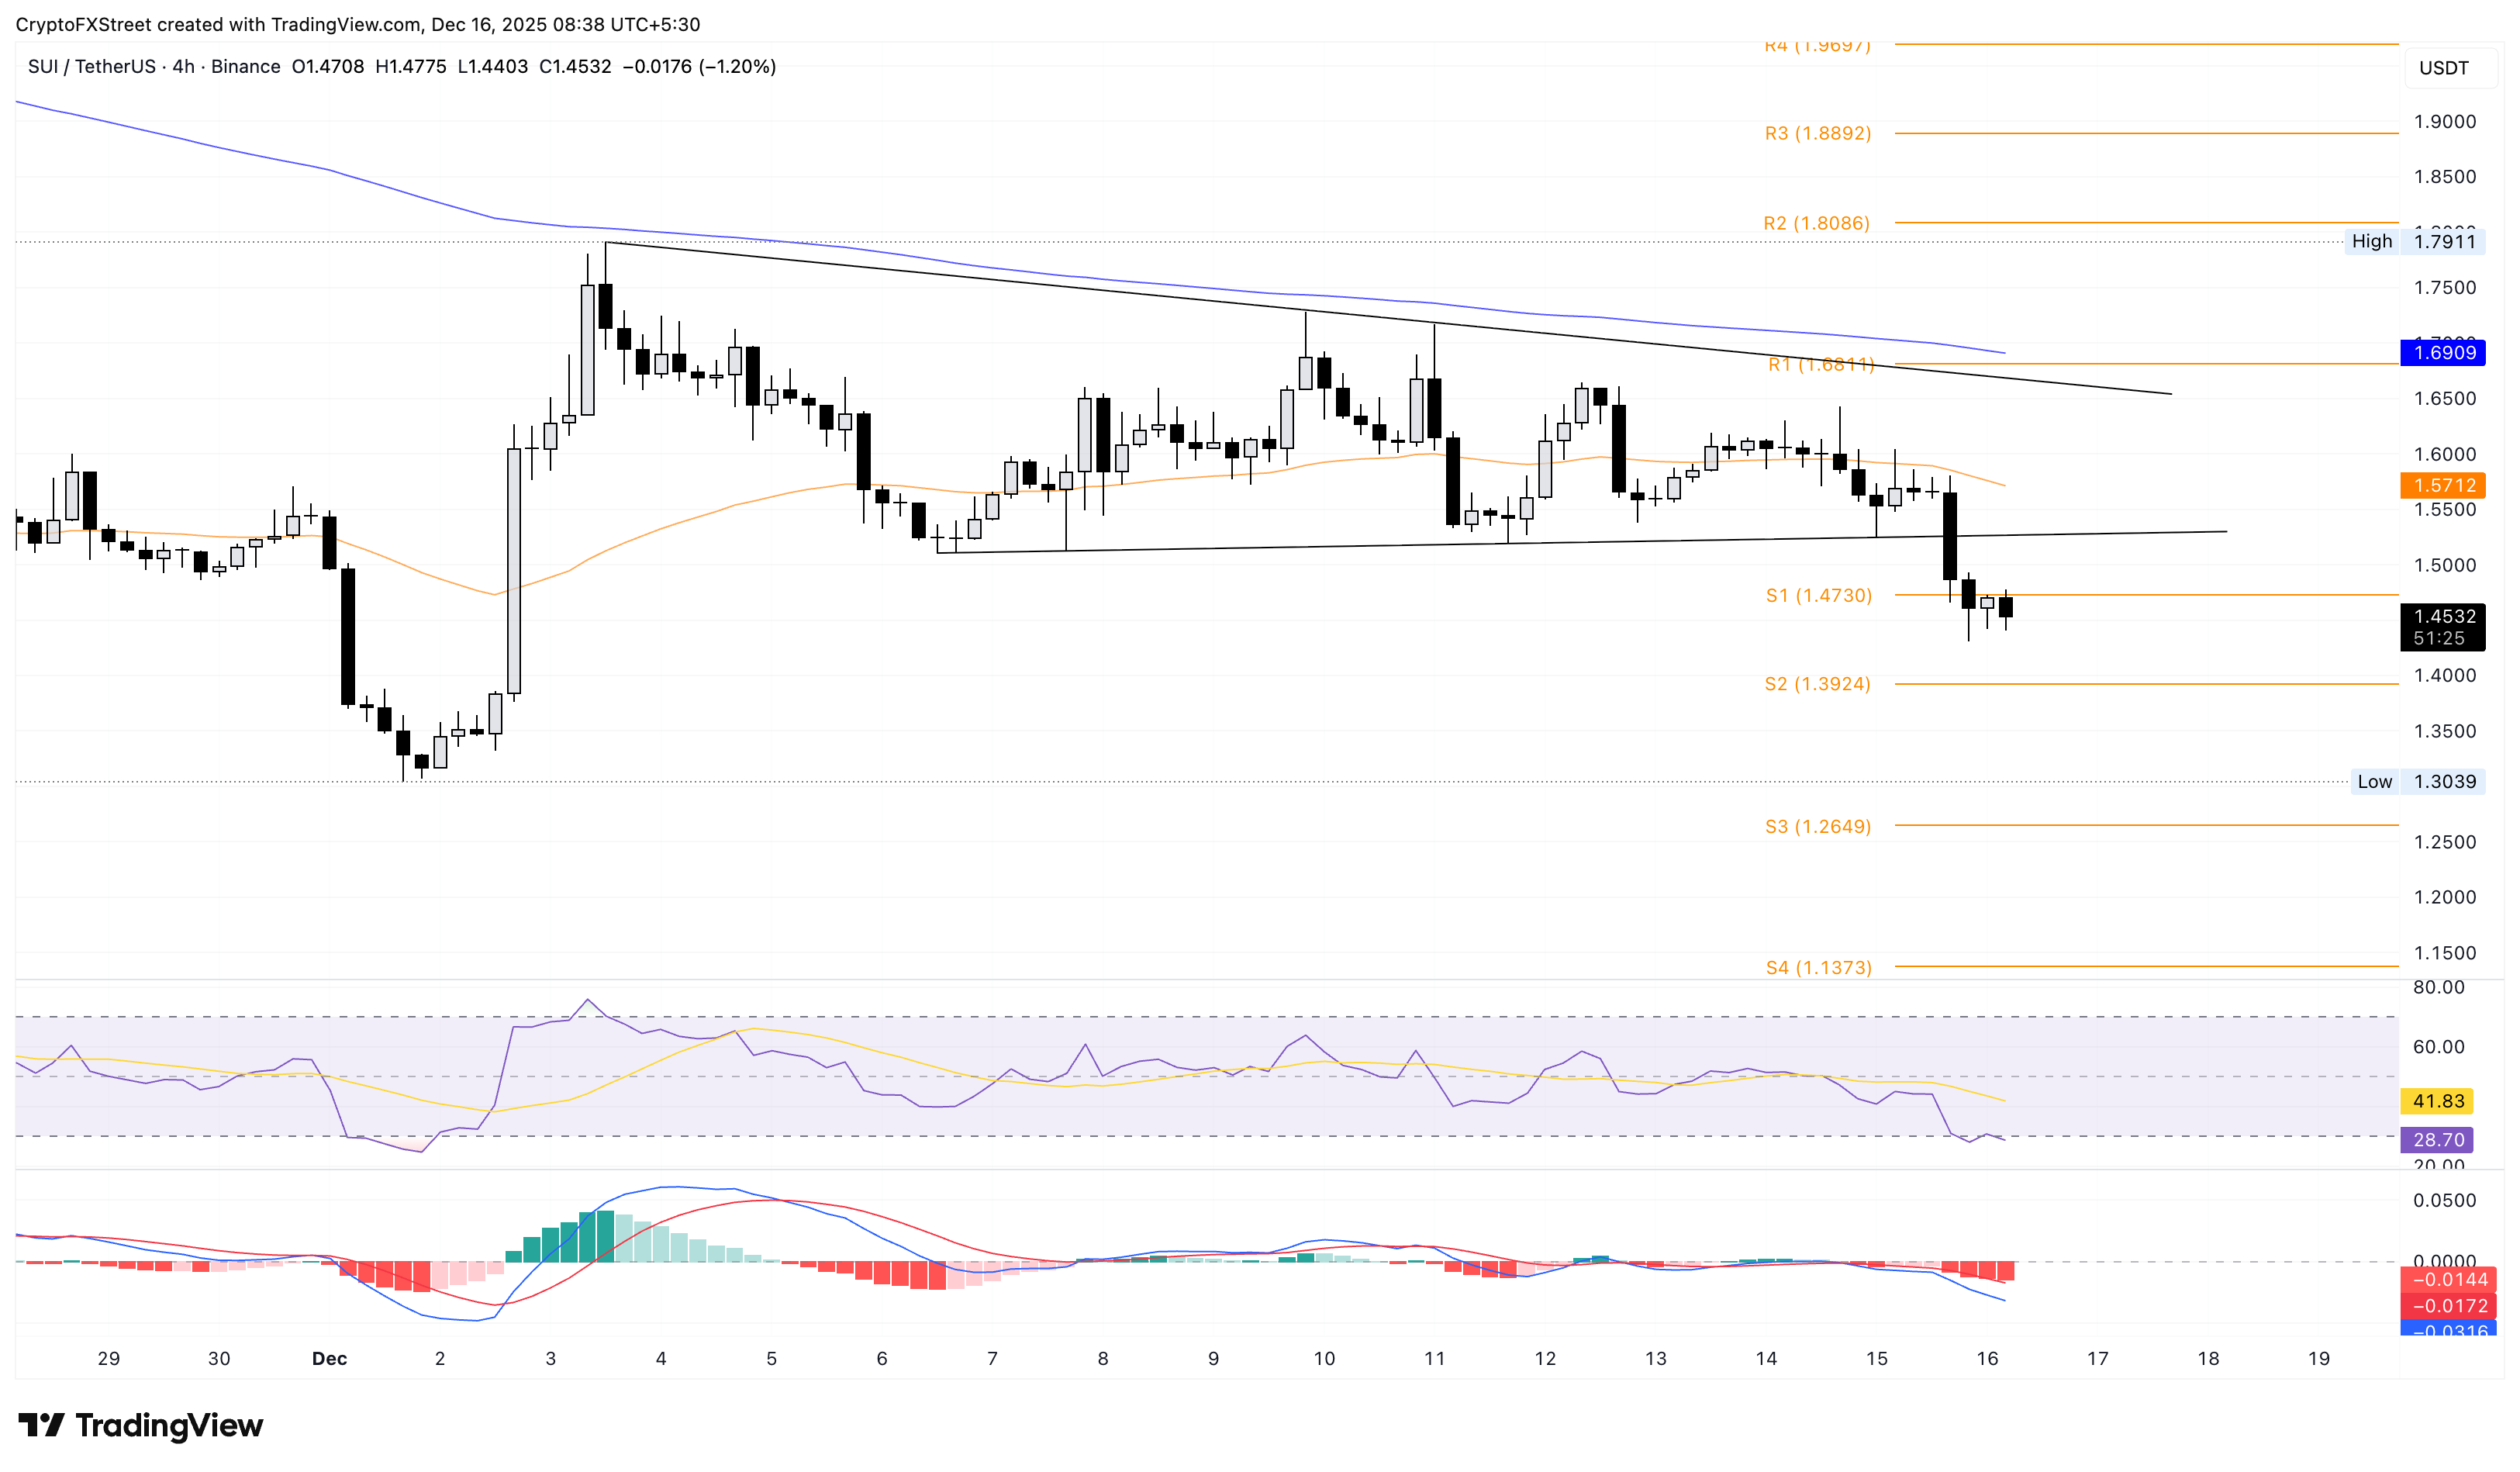
Looking up, if SUI resurfaces above $1.50, it could aim for the 50-period Exponential Moving Average (EMA) at $1.57.
Author

Vishal Dixit
FXStreet
Vishal Dixit holds a B.Sc. in Chemistry from Wilson College but found his true calling in the world of crypto.


