Litecoin Price Prediction: LTC at entry point for new bull rally
- Litecoin price rests at the intersection of two significant support levels.
- Largest eight-day decline since March 2020.
- LTC no longer a top-10 cryptocurrency by market capitalization.

Litecoin price came within six points of testing the 2017 high at $420 on May 10 before initiating a notable decline. LTC has reached a vital level that suggests the downside will be limited from price at the time of writing ($262.87). It is the ideal location for the payments token to begin a bottoming process to make another attempt at the all-time high.
Litecoin price has impressive upside potential
At the May 10 high at $413.91, Litecoin price had rallied almost 240% in 2021. A significant gain, but not near the contenders for the best gain of the year. The rally was confined to an ascending channel formation with the Litecoin 50-day simple moving average (SMA) and Ichimoku Cloud offering tangible support during the corrections.
At the May 9 high, Litecoin price had recorded a 73% gain over the previous 14 days, making it the best return since December 2020 and the second-best since 2018. On the same day, the daily Relative Strength Index (RSI) registered the highest reading since February and equaled a level that has coincided with LTC corrections going back to August 2020.
Since the May 10 high, Litecoin price has fallen 36% and currently shows a decline of 29% over the last eight days, marking the largest eight-day decline for Litecoin since the March 2020 cryptocurrency crash. Due to the deterioration, LTC has fallen out of the top-10 cryptocurrencies by market capitalization.
Presently, Litecoin price rests at the confluence of the 50-day SMA and the Ichimoku Cloud. Selling pressure may continue in the near term, but it should be contained by the cloud, considering the oversold condition highlighted by the eight-day decline of 29%.
The rebound will strike resistance at the midline of the LTC ascending channel at $315.85, then test the all-time high at $420.00, yielding a 58% gain. A successful breakthrough at the all-time high would usher in a test of the channel’s upper trend line at $462.37.
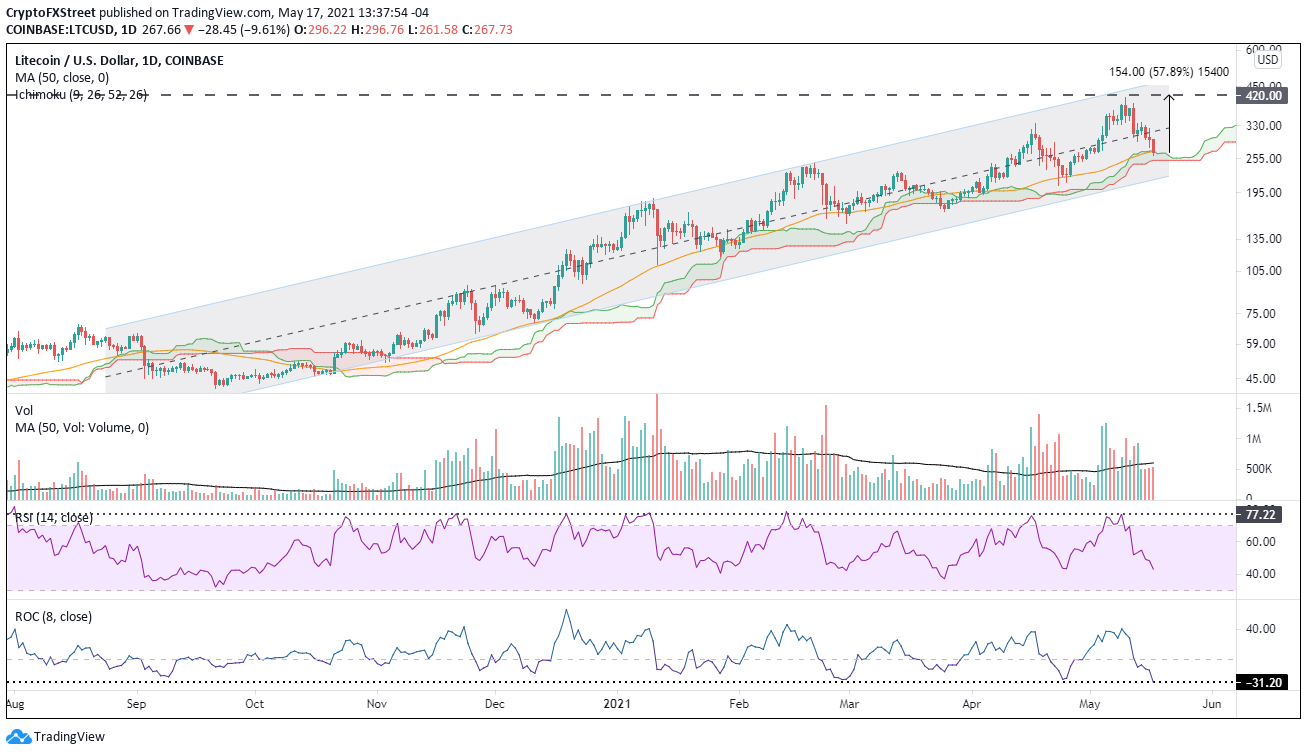
LTC/USD daily chart
If Litecoin price is unable to hold the lower limits of the Ichimoku cloud at $251.57, it will test the channel’s lower trend line at $214.16. Such a bearish impulse represents an additional loss of 20% for LTC.
Author

Sheldon McIntyre, CMT
Independent Analyst
Sheldon has 24 years of investment experience holding various positions in companies based in the United States and Chile. His core competencies include BRIC and G-10 equity markets, swing and position trading and technical analysis.


