Litecoin price analysis: LTC/USD peaks into the $60 zone and retreats back
- This Wednesday’s price session has found resistance at the SMA 50 curve.
- The Moving Average Convergence/Divergence (MACD) indicates increasing bullish momentum.

LTC/USD has retreated from the $60-zone following a brief flirtation, this Wednesday. The 20-day Bollinger band has slowly widened, indicating increasing market volatility. The hourly LTC/USD shows us that the buyers were able to break past intraday resistance at $60.30, and took the price up to $61. The sellers then took control of the market and corrected the price around $59.15.
LTC/USD daily chart
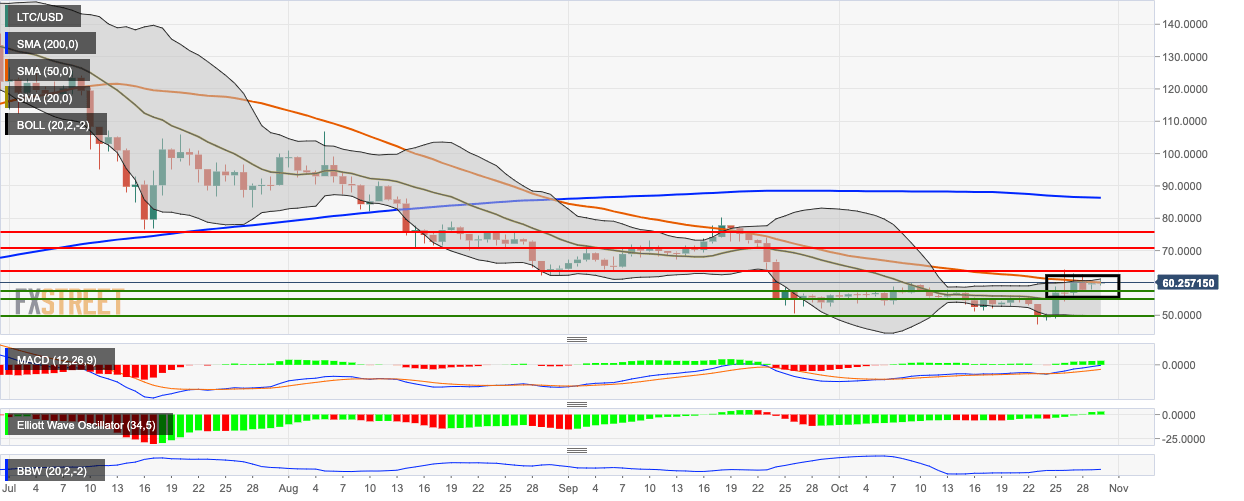
The price has found resistance at the 50-day Simple Moving Average (SMA 50) curve. The Moving Average Convergence/Divergence (MACD) indicates increasing bullish momentum, while the Elliott Oscillator has had six consecutive buyer heavy sessions of growing intensity.
Author

Rajarshi Mitra
Independent Analyst
Rajarshi entered the blockchain space in 2016. He is a blockchain researcher who has worked for Blockgeeks and has done research work for several ICOs. He gets regularly invited to give talks on the blockchain technology and cryptocurrencies.


