Litecoin Price Analysis: LTC/USD mired in technical correction
- Litecoin is moving down in sync with the cryptocurrency market.
- LTC/USD sell-offs may be extended towards psychological $50.00.

Litecoin, the 7th largest digital coin with the current market value of $3.5 billion, lost over 2.5% in the recent 24 hours amid global correction on the cryptocurrency market led by such altcoins as Bitcoin SV (-19%) and Bitcoin Cash (-7%). Bitcoin also retreated from the recent highs as the bulls hit the pause button. At the time of writing, LTC/USD is changing hands at $57.0, off the recent high registered at $60.68.
Currently, the coin is moving in sync with the market. Litecoin's price is influenced mostly by speculative sentiments and technical factors, while fundamental developments stay in the shadow. The cryptocurrency market is notorious for its herd behavior as everything is growing and falling simultaneously. While there some positive developments, like the launch of LTC futures on Binance with x75, they can hardly qualify for the key market catalyst.
Now that Bitcoin and several major altcoins including LTC hit critical resistance levels, the market started a technical correction, which is a natural development after an exaggerated upside move.
LTC/USD: technical picture
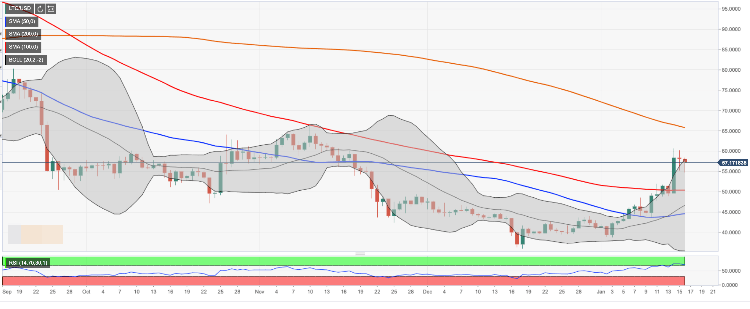
LTC/USD tested area above $60.00, however, the bulls failed to hold the ground. the wide-spread retracement on the market pushed the coin towards $56.00 with the next local support created by $54.73, which is the intraday low. However, the critical barrier awaits us on approach to $50.00. It is reinforced by SMA100 daily and SMA50 4-hour. This area is likely to limit the correction and serve as a jumping-off ground for another bullish wave; however, Once it is out of the way, the sell-off is likely to gain traction with the next focus on $46.70 (SMA100 4-hour).
On the upside, the inital resistance is created by the upper line of the daily Bollinger Band at $57.90. We will need to see a sustainable move above this level to retest $60.00 and the recent high of $60.68. The ultimate bulls' goal is created by SMA200 daily at $65.70.
Considering that the daily RSI has reversed to the downside, LTC/USD may be well-positioned for an extended bearish correction before another bull's wave.
LTC/USD daily chart
Author

Tanya Abrosimova
Independent Analyst


