Litecoin price analysis: LTC/USD keeps trending in a narrow >$10 range
- LTC/USD has immediate resistance at the SMA 20 curve.
- The Elliott Oscillator has had three straight bullish sessions.

For nearly a month, LTC/USD has been trending sluggishly in a >$10 range. The price of the asset has gone up slightly from $54.75 to $54.95 this Tuesday. The hourly breakdown shows us that the price fell to $54 before it went up to $55.55 in two hours. Following that, the bulls and bears have gone back and forth before settling around $54.95.
LTC/USD daily chart
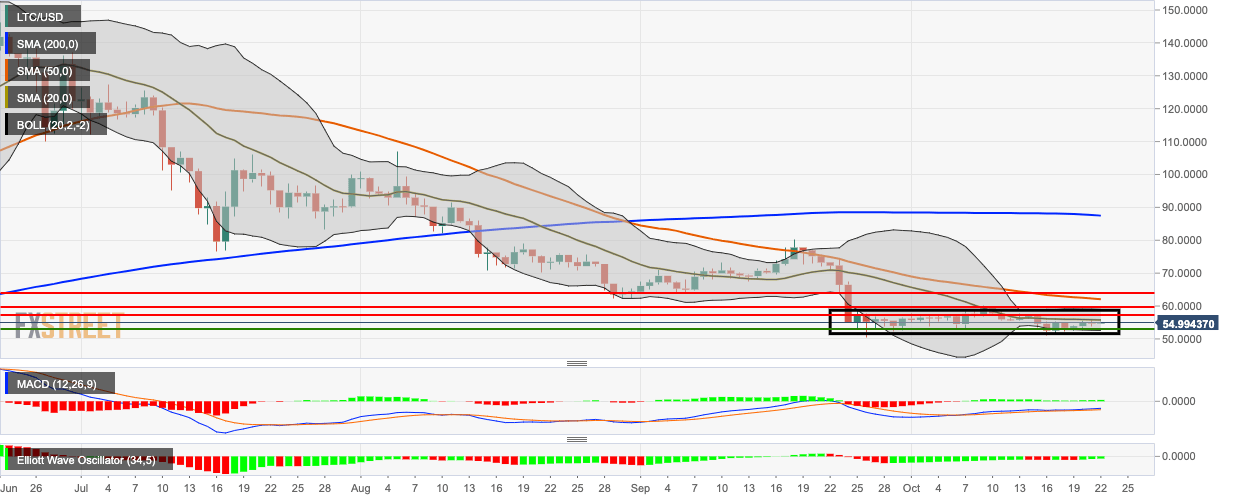
The daily price chart has found immediate resistance at the 20-day Simple Moving Average (SMA 20) and SMA 50 curves. The 20-day Bollinger band has constricted, indicating decreasing market volatility. The Moving Average Convergence/Divergence (MACD) indicates sustained bullish momentum. The Elliott Oscillator has had three green sessions following two red sessions.
Author

Rajarshi Mitra
Independent Analyst
Rajarshi entered the blockchain space in 2016. He is a blockchain researcher who has worked for Blockgeeks and has done research work for several ICOs. He gets regularly invited to give talks on the blockchain technology and cryptocurrencies.


