Litecoin price analysis: LTC/USD about-turns at $140 – Double-top pattern in action
- Litecoin recovery hits a dead end at $140 but the downside is strongly supported.
- The formation of a double-top pattern on the 1-h chart is further pulling the price towards the short-term $136 support.

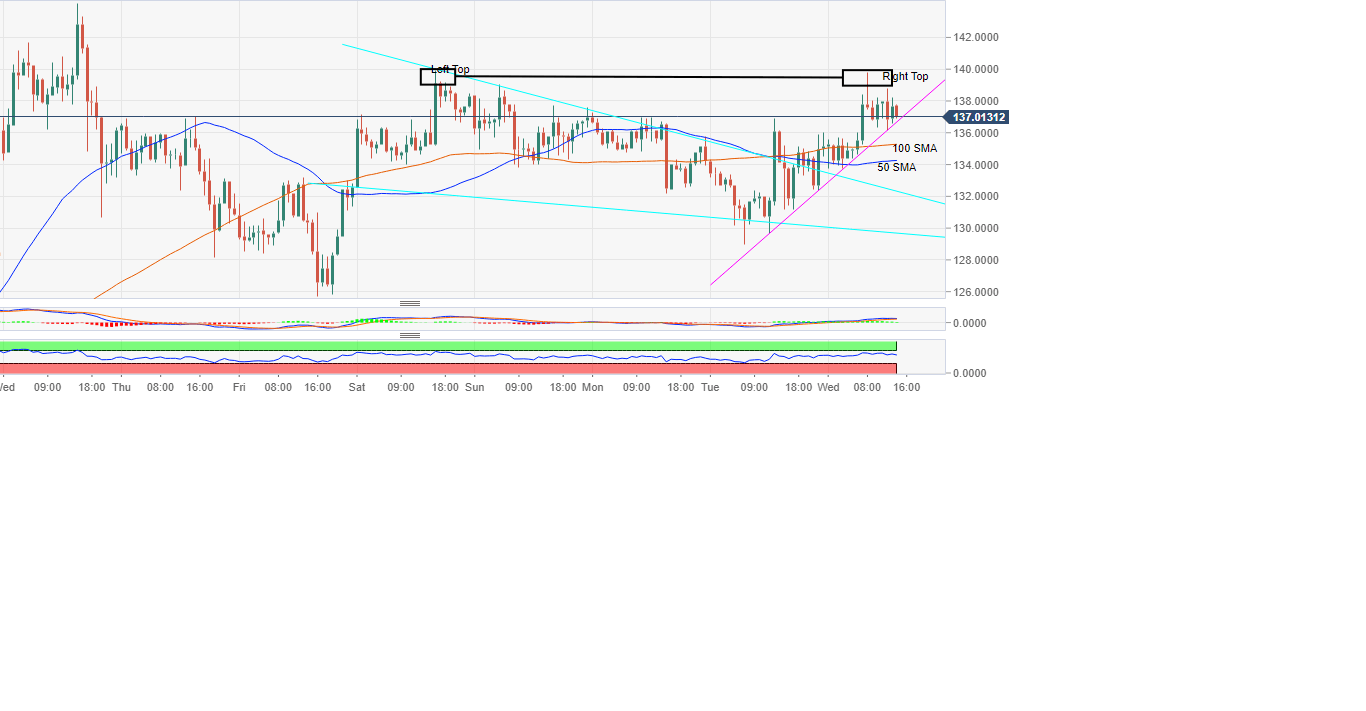
Litecoin price is facing various technical scenarios on Wednesday. Initially, there was a break from the falling wedge pattern after the gains from the recent Bitcoin driven surge hit a hurdle at $140. LTC/USD tested the levels under $130 and formed a low at $128.95.
The breakout from the wedge pattern further pushed the reversal above the 50 Simple Moving Average (SMA) 1-h as well as the 100 SMA 1-h. LTC/USD gains tested $140 level for the second time four days. The sellers’ congestion at $140 barricaded the area stopping movements north.
Consequently, the formation of a double-top pattern on the 1-h chart is further pulling the price towards the short-term $136 support. But before that, the trendline will try to stop the declines. The 100 SMA currently at $135.25 will offer support as well with the 50 SMA 1-h coming in handy at $134. Litecoin also enjoys strong support at $1.0 and the region between $125-$128.
LTC/USD 1-h chart
Author

John Isige
FXStreet
John Isige is a seasoned cryptocurrency journalist and markets analyst committed to delivering high-quality, actionable insights tailored to traders, investors, and crypto enthusiasts. He enjoys deep dives into emerging Web3 tren


