|

Litecoin Price Analysis: LTC/USD has a chance to recover towards $40.00

  • LTC/USD has settled above $37.00 after a sharp sell-off.
  • The technical picture implies that the coin may regain some ground.

Litecoin (LTC), the sixth-largest digital asset with the current market capitalization of $2.3 billion, has been losing ground rapidly. LTC/USD has lost about 6.5% of its value in recent 24 hours to trade at $37.11 at the time of writing. 

Litecoin is moving in sync with the market. Therefore, it is vulnerable to bearish sentiments on the broad cryptocurrency market and may regain some ground if the market starts a recovery. As the liquidity is decreasing ahead of the Christmas holiday period, the coin may demonstrate sharp movements in either direction. 

Litecoin's technical picture

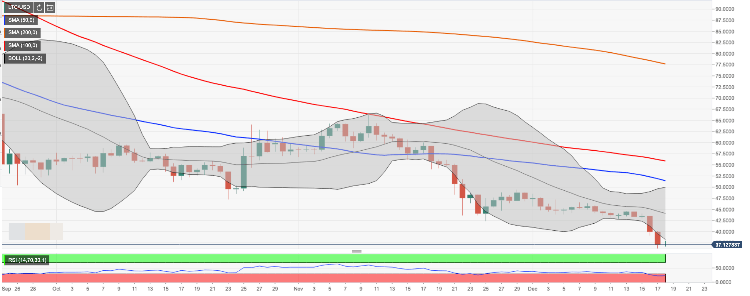
On a daily chart, LTC/USD broke below the Bollinger Band to trade at $37.12, off the recent low of $36.28. The daily RSI (Relative Strength Index) is demonstrating signs of reversal from the oversold territory. This technical setup implies that the price may regain some ground with the first recovery target created by the lower line of the daily Bollinger Band at $38.23. Once it is out of the way, the upside is likely to gain traction with the next focus on psychological $40.00 and $44.00 ( the middle line of the daily Bollinger Band). Notably, this area served as a resistance at the beginning of December. 

If the sell-off resumes, LTC/USD may retest the recent low of $36.28 and continue the decline towards the lower line of the Bollinger Band on a weekly chart ($35.50). If this area gives way, a psychological $30.00 will come into view. The last time LTC traded below this handle was in January 2019. Once it is out of the way, we will be mainly in uncharted territory. 

LTC/USD daily chart

Author

Tanya Abrosimova

Tanya Abrosimova

Independent Analyst


More from Tanya Abrosimova
Share:

Editor's Picks

Grass 20% bullish breakout defies broader market weakness

Grass (GRASS) is edging up above $0.30 at the time of writing on Monday. The token’s notable 20% intraday surge stands out amid heightened volatility in the broader crypto market.

XRP slides as US-Iran war weakens sentiment

Ripple remains under pressure, trading around $1.35 at the time of writing on Monday. The remittance token extended its down leg to $1.27 on Saturday after the US, in collaboration with Israel, launched attacks on Iran, killing the nation’s Supreme Leader, Ali Khamenei.

Crypto Today: Bitcoin pares losses, Ethereum and XRP drift lower as Middle East conflict pressures risk assets

Bitcoin, Ethereum and Ripple remain on edge as the Israel-US war on Iran risk-off sentiment. The Crypto King trades above $66,000 at the time of writing on Monday, but is struggling to break through the seller congestion around $67,000.

Bitcoin on brink of breakdown amid US-Iran war

Bitcoin (BTC) remains under pressure near the key support level of $65,700. Trading at $66,400 at the time of writing on Monday, a breakdown below this critical level would suggest a deeper correction ahead.

Bitcoin Price Annual Forecast: BTC holds long-term bullish structure heading into 2026

Bitcoin (BTC) is wrapping up 2025 as one of its most eventful years, defined by unprecedented institutional participation, major regulatory developments, and extreme price volatility.

Bitcoin: Another month of losses, and it’s been five

Bitcoin (BTC) price is stabilizing around $68,000 at the time of writing on Friday, but the Crypto King is poised to close February on a fragile footing, marking its fifth consecutive month of losses since October and a rare start to the year with back-to-back monthly corrections.