Litecoin (LTC) Price Analysis: LTC/USD clinches to $44.00 for dear life
- LTC/USD has been locked in a tight range above critical support.
- The initial resistance is located on the approach to psychological $50.00.

Litecoin (LTC), the sixth-largest digital asset with the current market capitalization of $2.8 billion, has been oscillating inside a tight range since the beginning of December. LTC/USD has barely changed in recent 24 hours, hovering above $44.00 barrier.
Notably, the coin has lost over 29% of its value in the latest 30 days and became one of thee worst-performers of the month. However, despite the sharp sell-off after the halving that took place in August, LTC/USD is still 50% higher than in January.
We have already reported that Litecoin's issues have been aggravated by the decreasing hash rate. This development is a signal that miners are abandoning the network, leaving it vulnerable to attach 51%.
Litecoin's technical picture
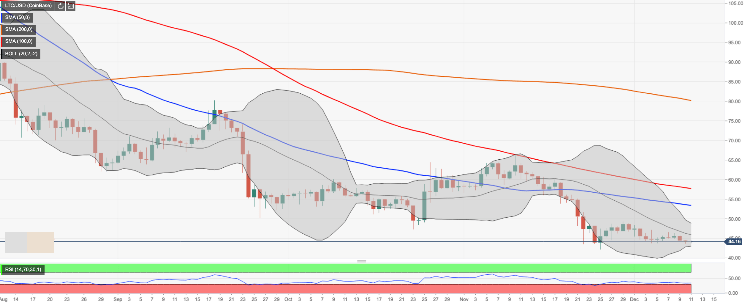
On a daily chart, LTC/USD is moving inside a narrowing range with the initial upside barrier created by the middle line of the daily Bollinger Band on approach to $46.00. Once it is cleared, the recovery may be extended towards the psychological $50.00; however, the pivotal hurdle is created by SMA50 (Simple Moving Average) daily at $53.40. LTC/USD has been trading below this line since November 18. Also, we will need to see a recovery of $57.70 (SMA100 daily) to confirm the reversal.
On the downside, a sharp decline below $44.00 will increase the sell-off pressure and push the price towards $42.16. This barrier is created by the lowest level of the previous month. Once it is broken, the price will proceed to psychological $40.00. That's where new buyers are likely to join the game and save the day for LTC; however, if it is broken, the bearish momentum may start snowballing.
LTC/USD, the daily chart
Author

Tanya Abrosimova
Independent Analyst


