Pump.fun Price Forecast: PUMP holds modest gains despite low retail demand, falling revenue
- Pump.fun edges above $0.0018 on Friday as bulls tighten their grip.
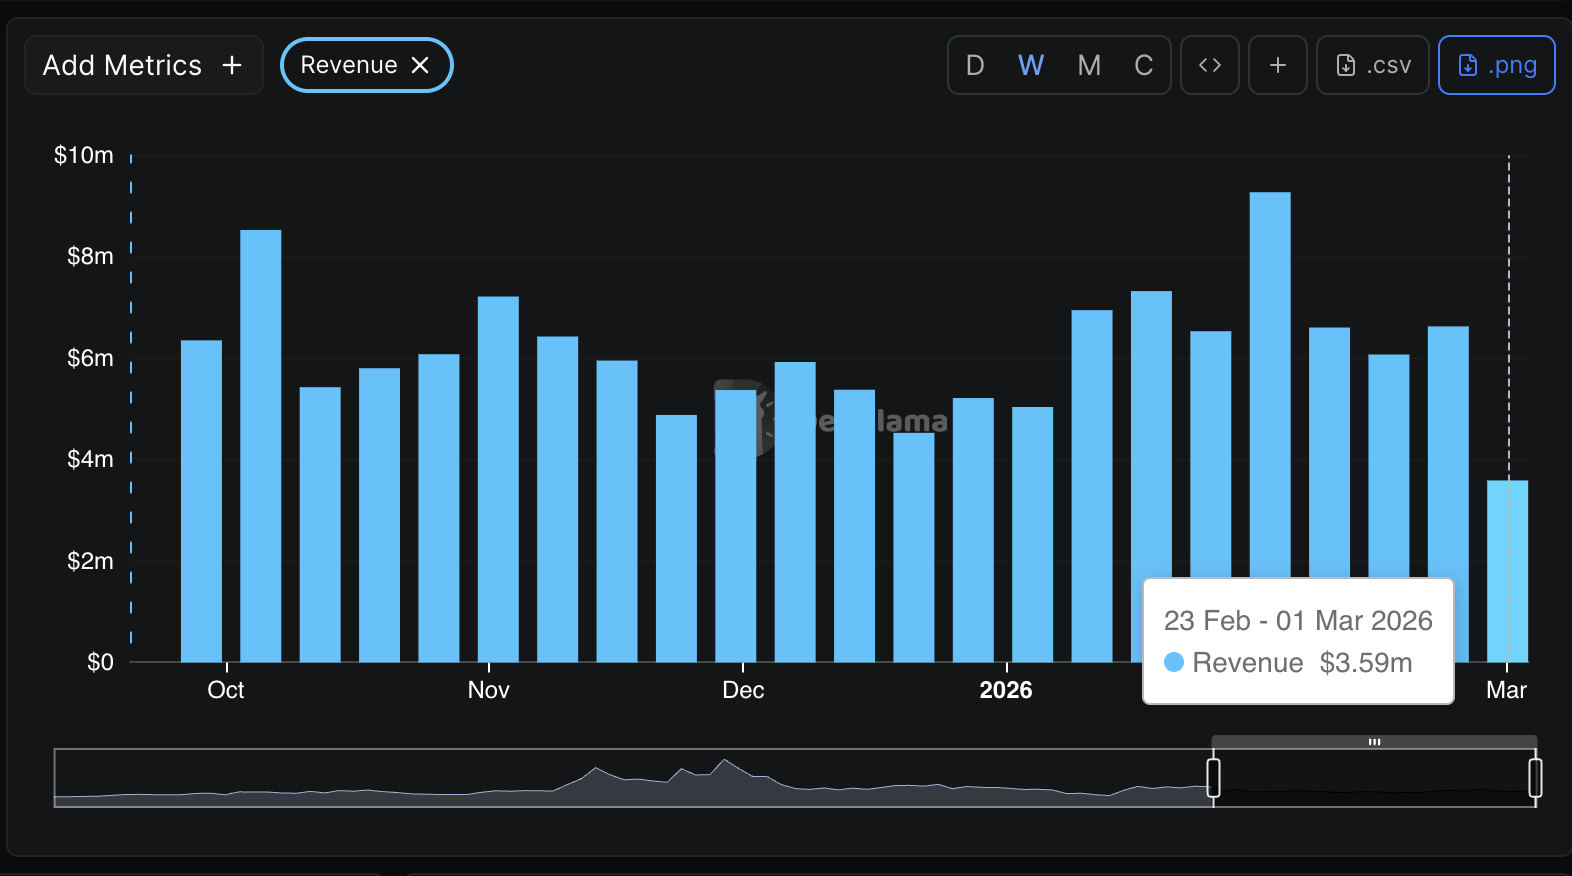
- Pump.fun platform weekly revenue drops from $6.6 million to $3.6 million through Thursday.
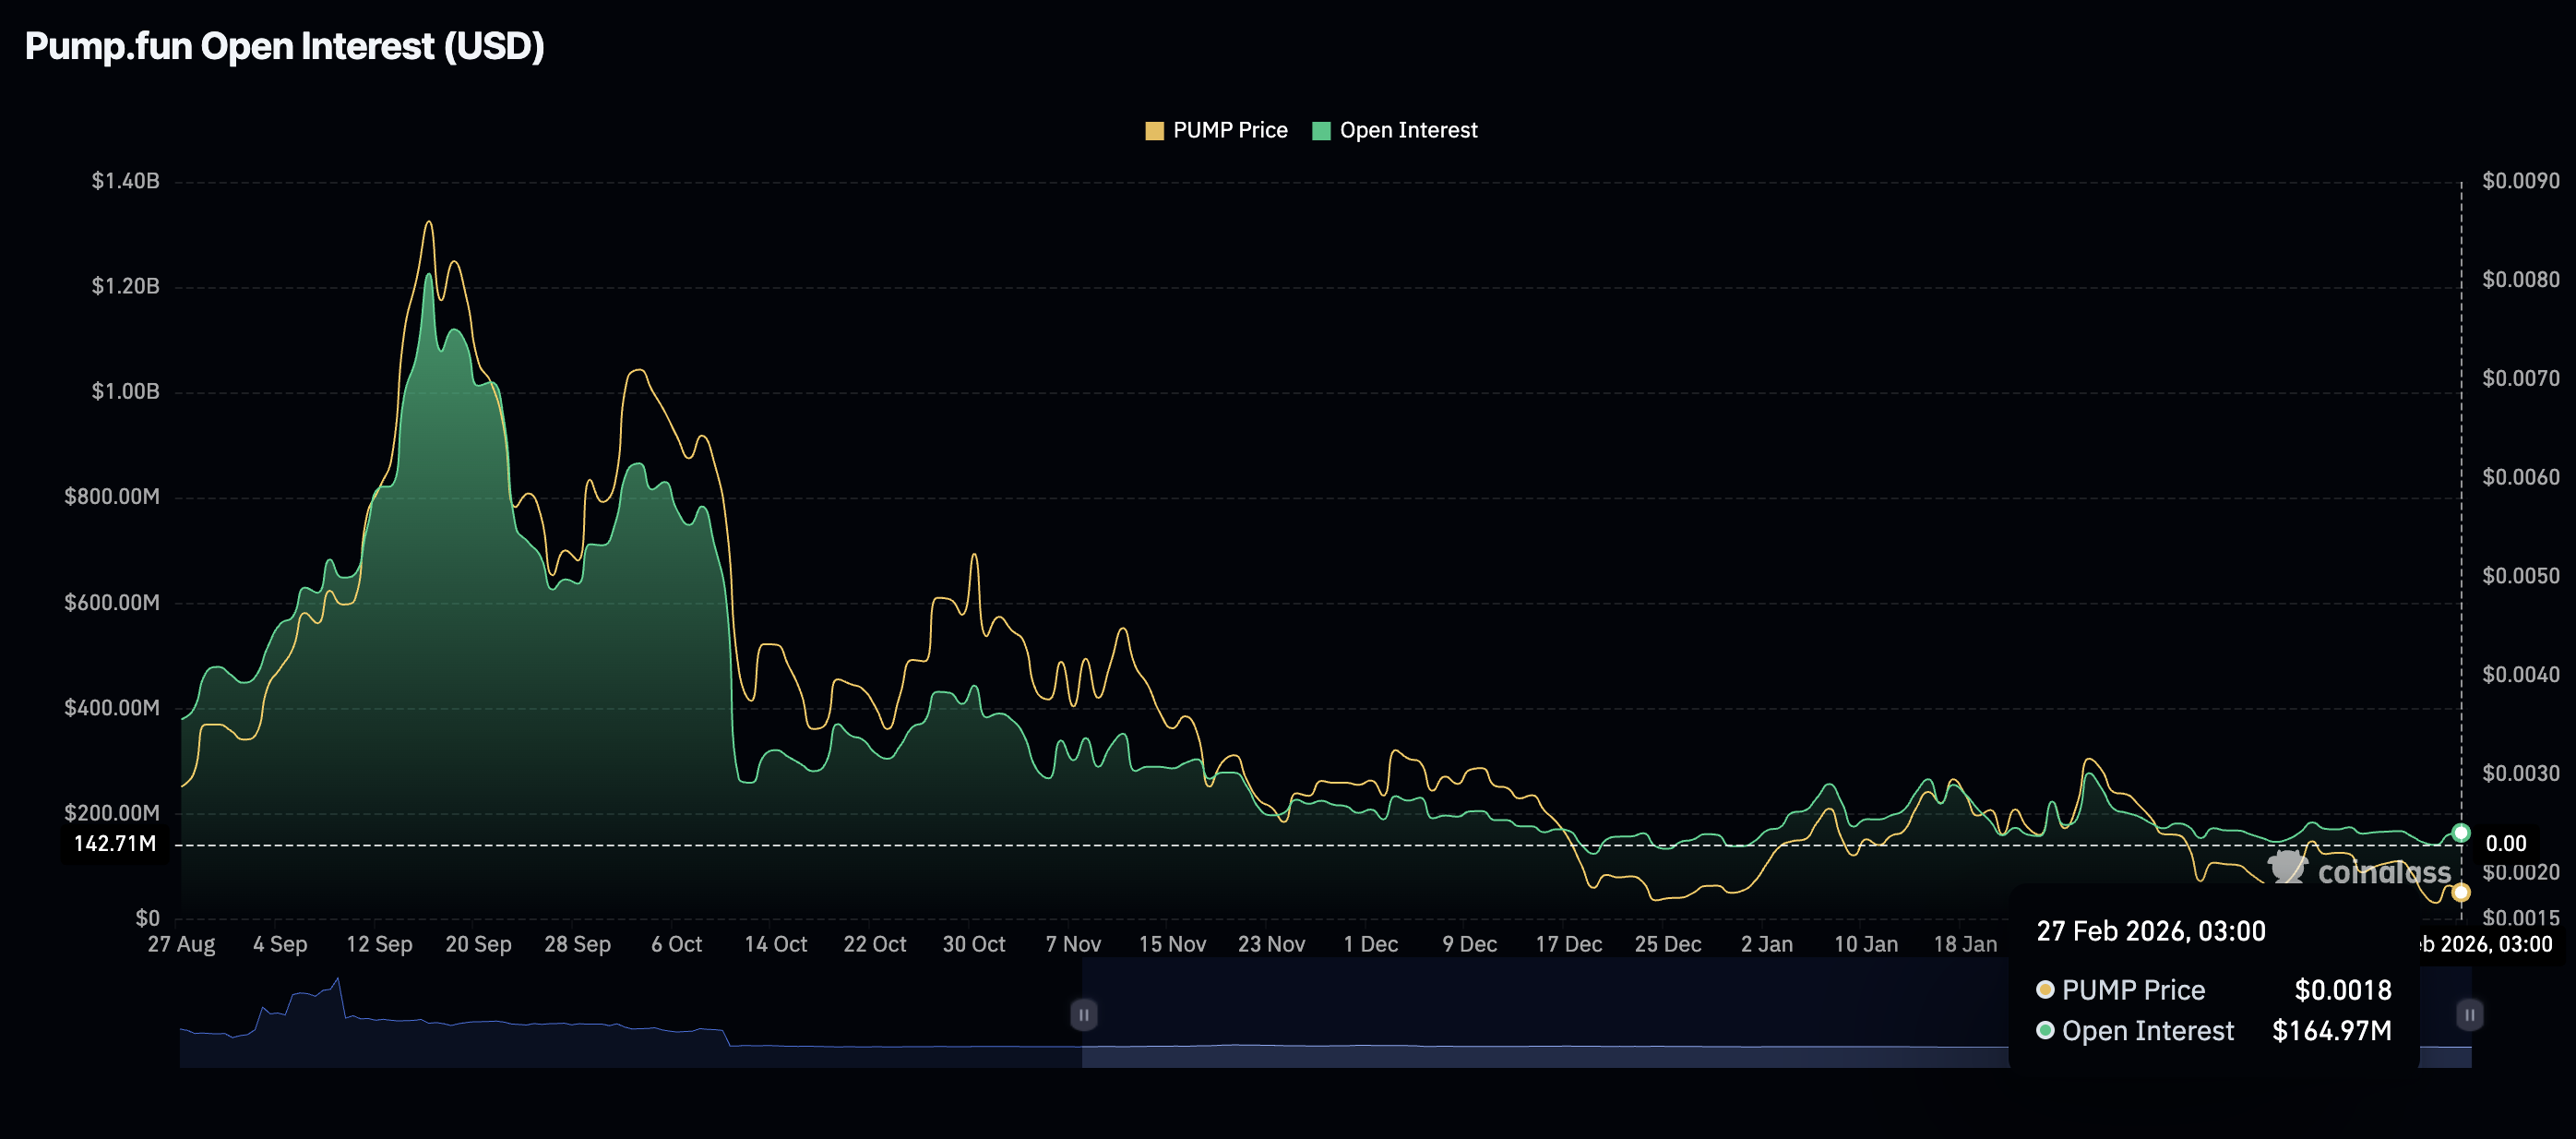
- Retail demand for PUMP derivatives remains muted, with futures Open Interest plateauing around $165 million.

Pump.fun (PUMP) holds steady above $0.0018 at the time of writing on Friday, reflecting a minor intraday increase despite the headwind trimming weekly gains in the broader cryptocurrency market.
However, a wider view shows that the token native to the meme coin launchpad and trading platform is down nearly 10% from its weekly opening price of $0.0020, aligning with the overall bearish outlook in the crypto market. PUMP’s persistent downtrend reflects doldrums in the derivatives market and platform revenue.
Pump.fun revenue fades amid low retail interest
Pump.fun revenue has been on a steady decline over the past few weeks, averaging $3.59 million through Thursday this week, down from $6.63 billion the previous week. DefiLlama data reinforces the decline, highlighting that Pump.fun’s $9.27 million revenue in the week starting January 26 through February 6.
Pump.fun relies on platform revenue to fund the token buyback program, which aims to reduce PUMP’s circulating supply and build long-term value.
The derivatives market is also on the back foot, as PUMP’s futures Open Interest (OI) stabilises around $165 million on Friday. Over the last two weeks, OI, which tracks the notional value of outstanding futures contracts, has remained between $142 million and $185 million.
In contrast, OI hit a record $1.23 billion in September, coinciding with PUMP’s record $0.0090 high. This massive slump in OI undermines retail investor interest.
Technical outlook: PUMP holds key support
PUMP holds onto support at $0.0018 as bulls push for a near-term breakout above the pivotal $0.0020 level. Looking ahead, its upside appears limited by the falling 50-day Exponential Moving Average (EMA) at $0.0022, the 100-day EMA at $0.0026 and the 200-day EMA at $0.0033.
The Moving Average Convergence Divergence (MACD) indicator holds below its signal line on the daily chart, signaling a potential build of bearish momentum. At the same time, the Relative Strength Index (RSI) at 41 remains below the midline, suggesting a bearish leaning outlook.
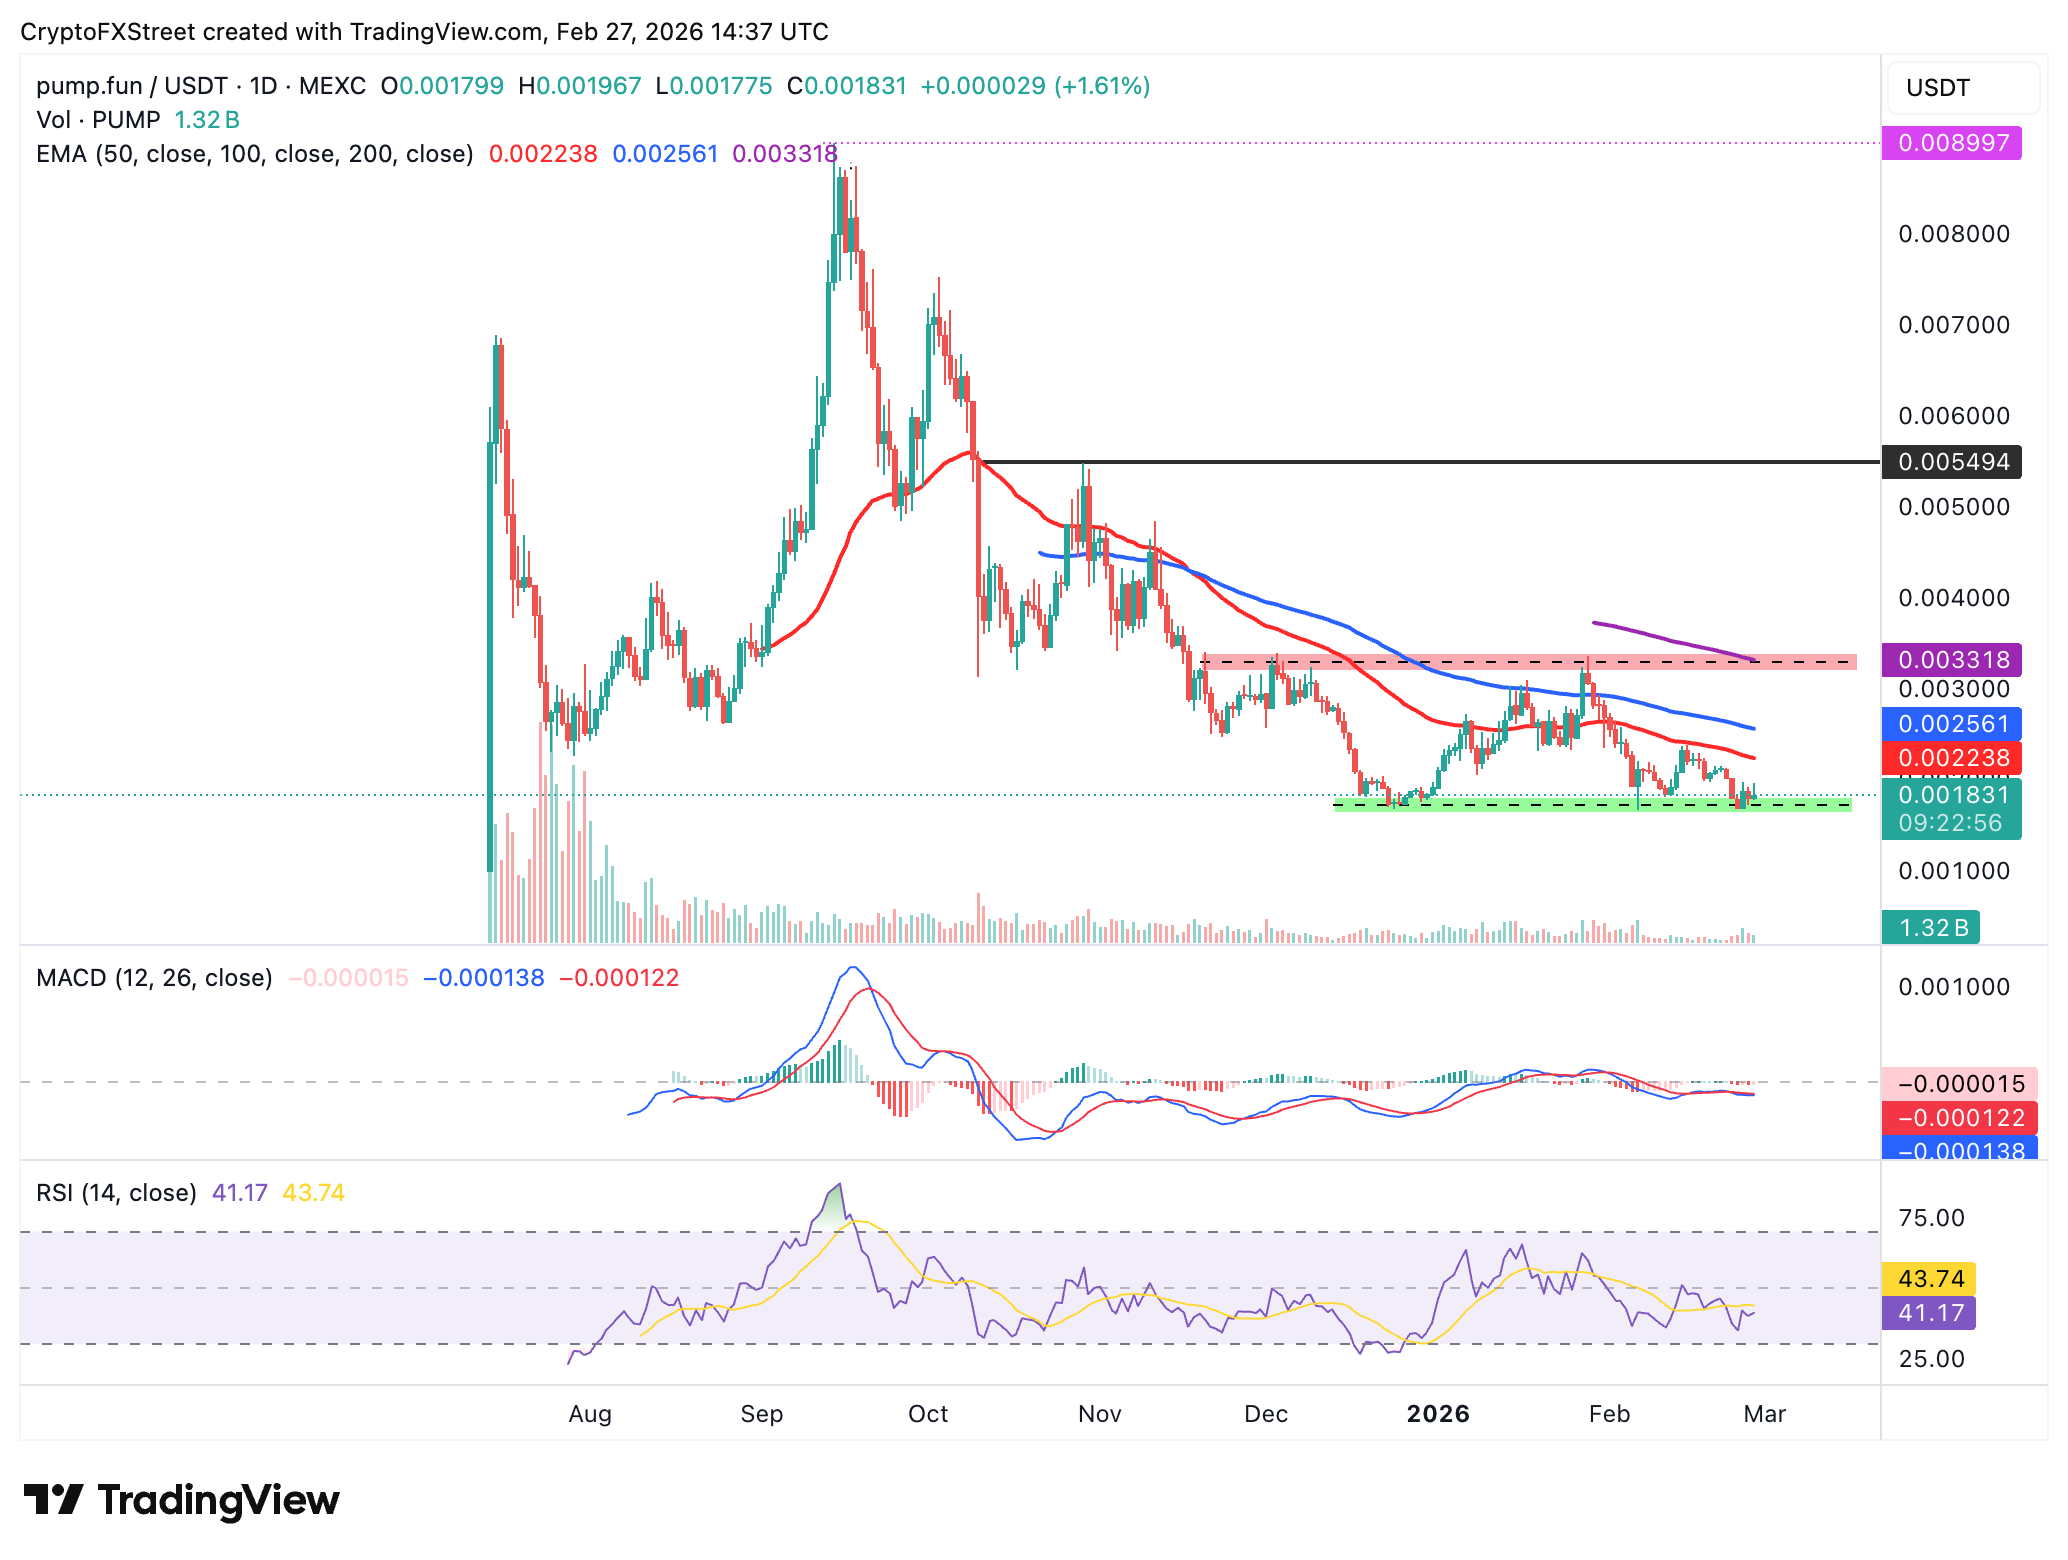
Meanwhile, failure to hold support at $0.0018 may push PUMP toward the weekly low of $0.0017. Below this level, PUMP may be unsupported and could fall to its all-time low at $0.0010.
Open Interest, funding rate FAQs
Higher Open Interest is associated with higher liquidity and new capital inflow to the market. This is considered the equivalent of increase in efficiency and the ongoing trend continues. When Open Interest decreases, it is considered a sign of liquidation in the market, investors are leaving and the overall demand for an asset is on a decline, fueling a bearish sentiment among investors.
Funding fees bridge the difference between spot prices and prices of futures contracts of an asset by increasing liquidation risks faced by traders. A consistently high and positive funding rate implies there is a bullish sentiment among market participants and there is an expectation of a price hike. A consistently negative funding rate for an asset implies a bearish sentiment, indicating that traders expect the cryptocurrency’s price to fall and a bearish trend reversal is likely to occur.
Author

John Isige
FXStreet
John Isige is a seasoned cryptocurrency journalist and markets analyst committed to delivering high-quality, actionable insights tailored to traders, investors, and crypto enthusiasts. He enjoys deep dives into emerging Web3 tren


