Crypto Today: Bitcoin, Ethereum, XRP struggle to hold onto weekly gains amid cautious outlook
- Bitcoin hovers around $67,000 as MACD and RSI momentum indicators signal subtle bullishness.
- Ethereum tests the upper end of a narrow range, with the intraday low at around $1,980 as immediate support.
- XRP keeps trading within an overall bearish trend, as reflected by the downtrending all main daily EMAs.

The broader cryptocurrency market shows signs of measured optimism, with leading coins stabilizing above key short-term support levels. Bitcoin (BTC) treads water around $67,000 at the time of writing on Friday, as investors appear to be turning cautiously bullish within the overall downtrend.
Meanwhile, altcoins, including Ethereum (ETH) and Ripple (XRP), are also broadly steady. Ethereum holds slightly below $2,000 while Ripple hovers around $1.40, reflecting stability across the crypto market.
Bitcoin, Ethereum and XRP upside momentum at risk amid low retail interest
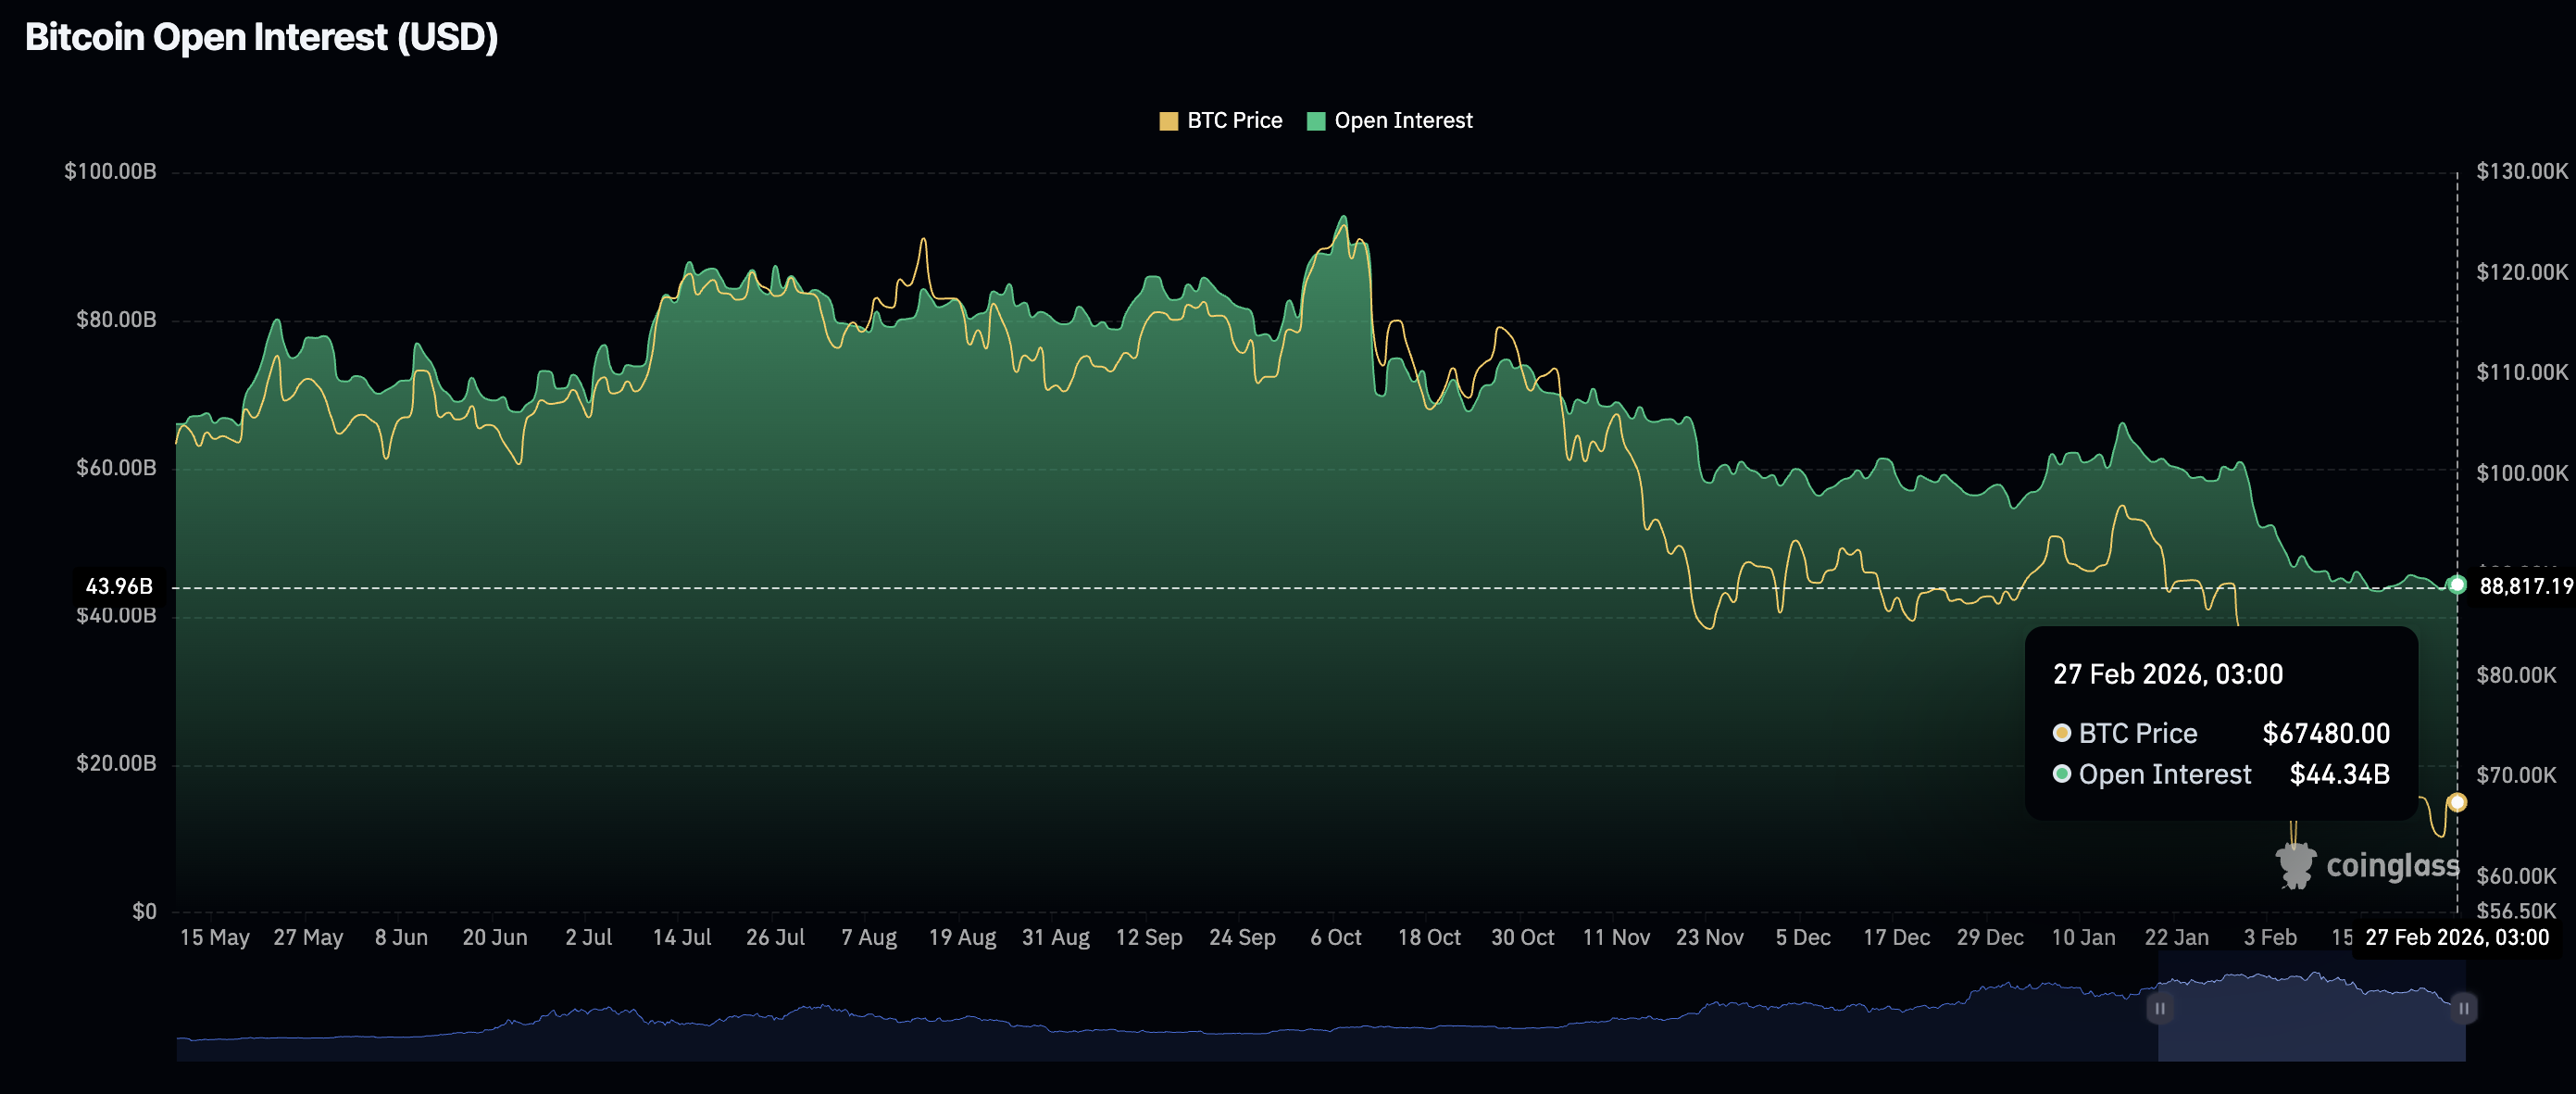
Bitcoin’s recovery from a weekly low at $62,513 occurred despite low retail interest, as reflected by futures Open Interest sliding to $44.34 billion on Friday, a level last seen on February 17, from $45.13 billion the previous day.
Since the Crypto King derivatives hit a record $94.12 billion in OI in October, the downtrend has persisted, suggesting that investors lack confidence in the market and in BTC’s ability to sustain an uptrend.
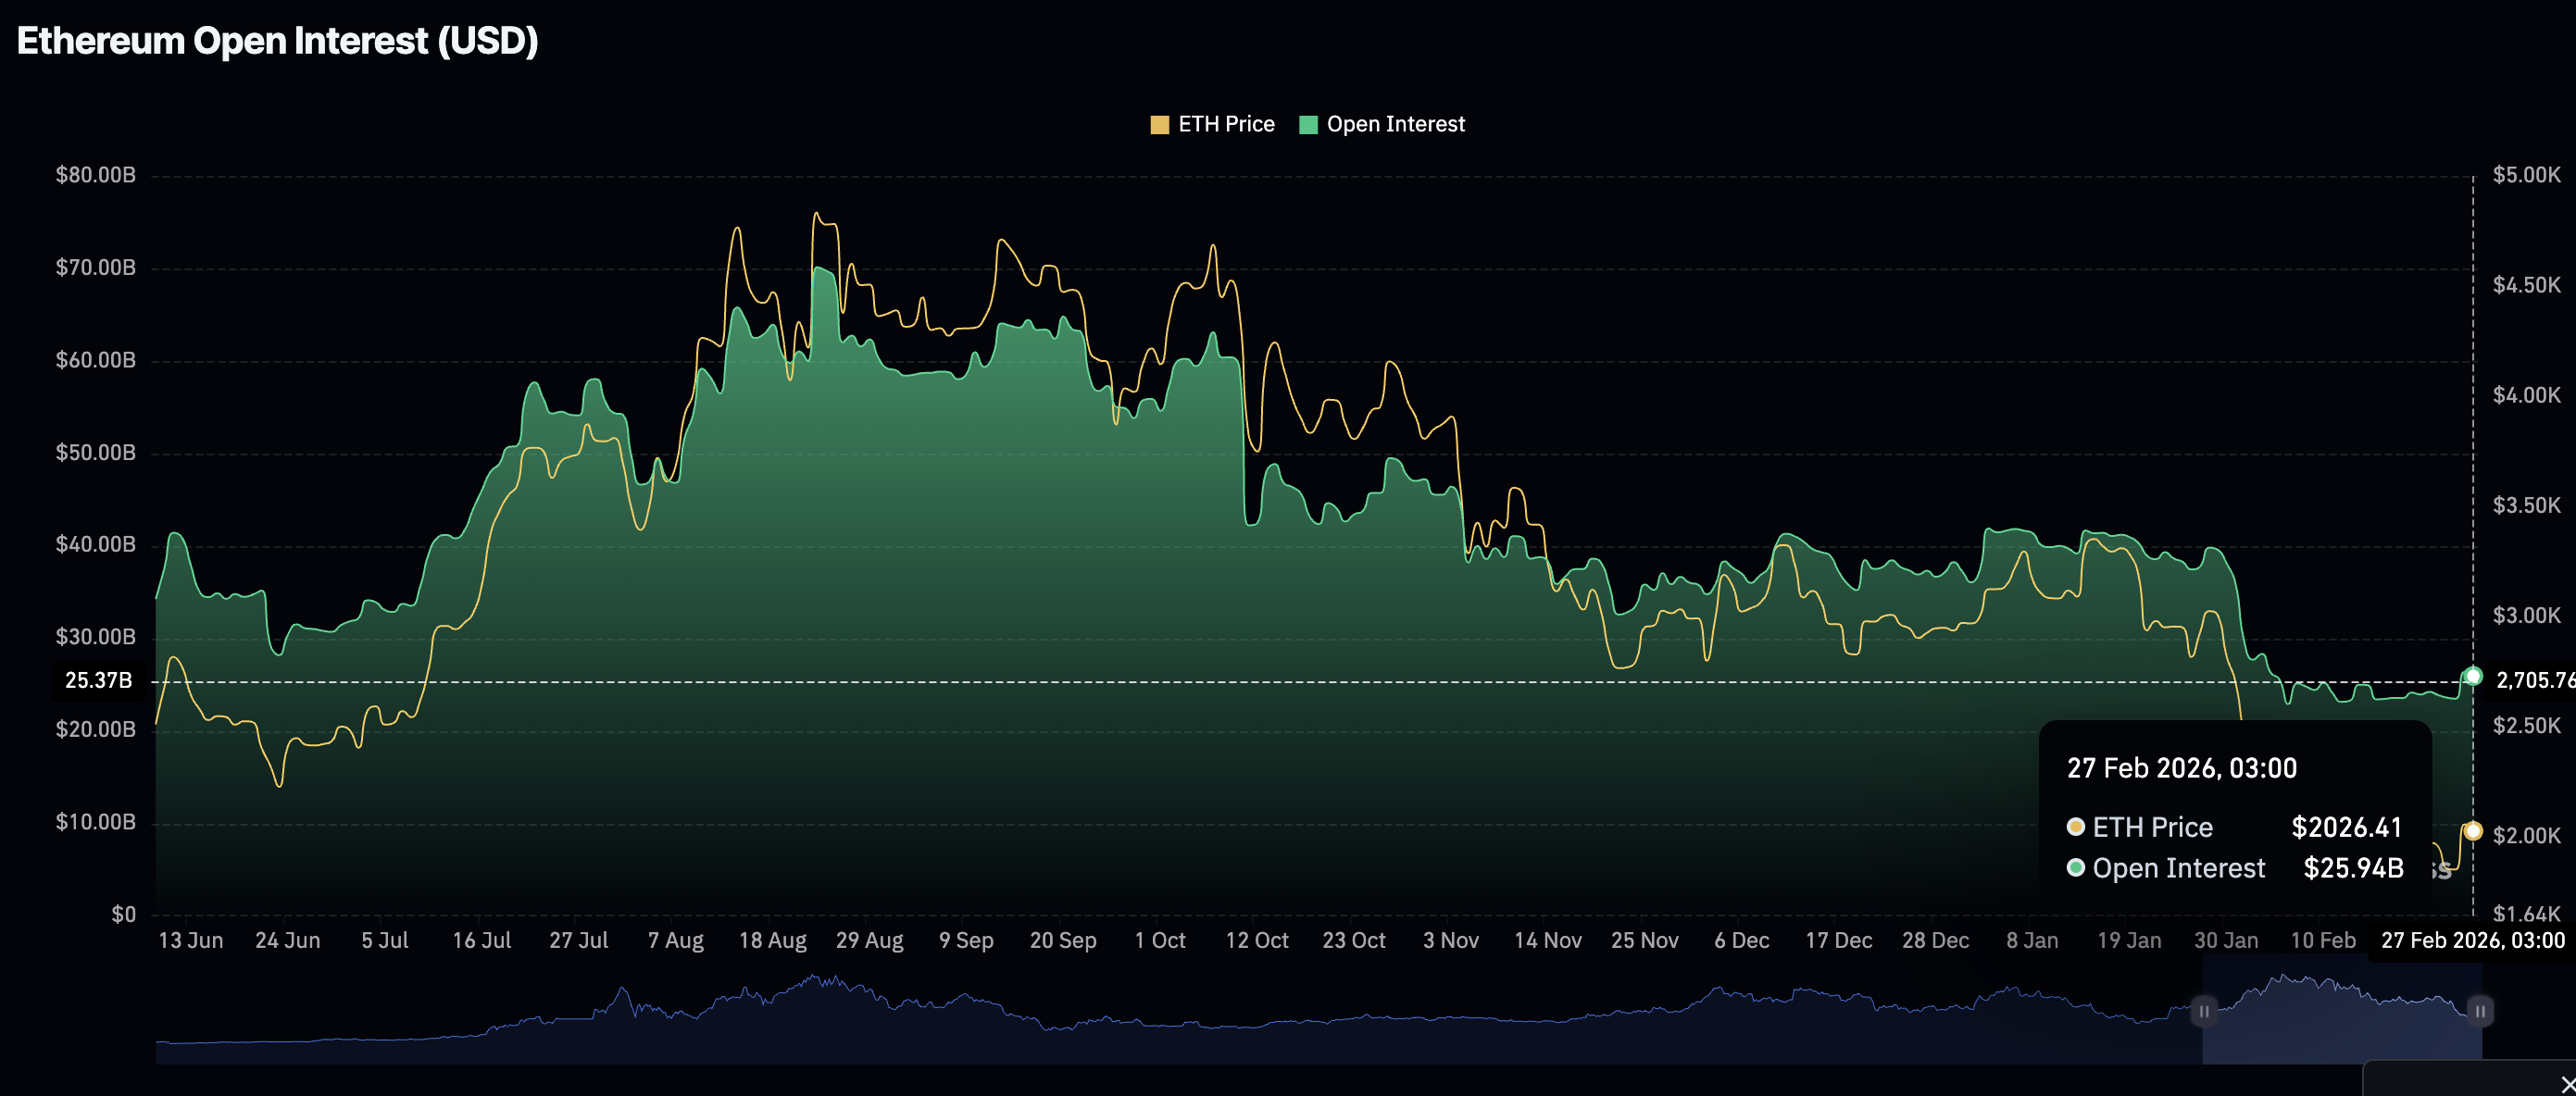
Ethereum is also trading amid low retail activity, with the derivatives market recording a minor decrease in futures OI to $25.94 billion on Friday from $26.4 billion the previous day. In contrast, the OI hit a record $70.12 billion in August, which coincided with Ethereum rallying to $4,956, its all-time high.
As with Bitcoin and Ethereum, XRP is facing a significant slump in derivatives activity, with futures OI fading to $2.3 billion on Friday, its lowest level since January 2025, from $2.35 billion the previous day. XRP futures OI hit a record $10.94 billion in July, supporting a price increase to $3.66 in the same month before bullish sentiment faded amid volatility and persistent declines.
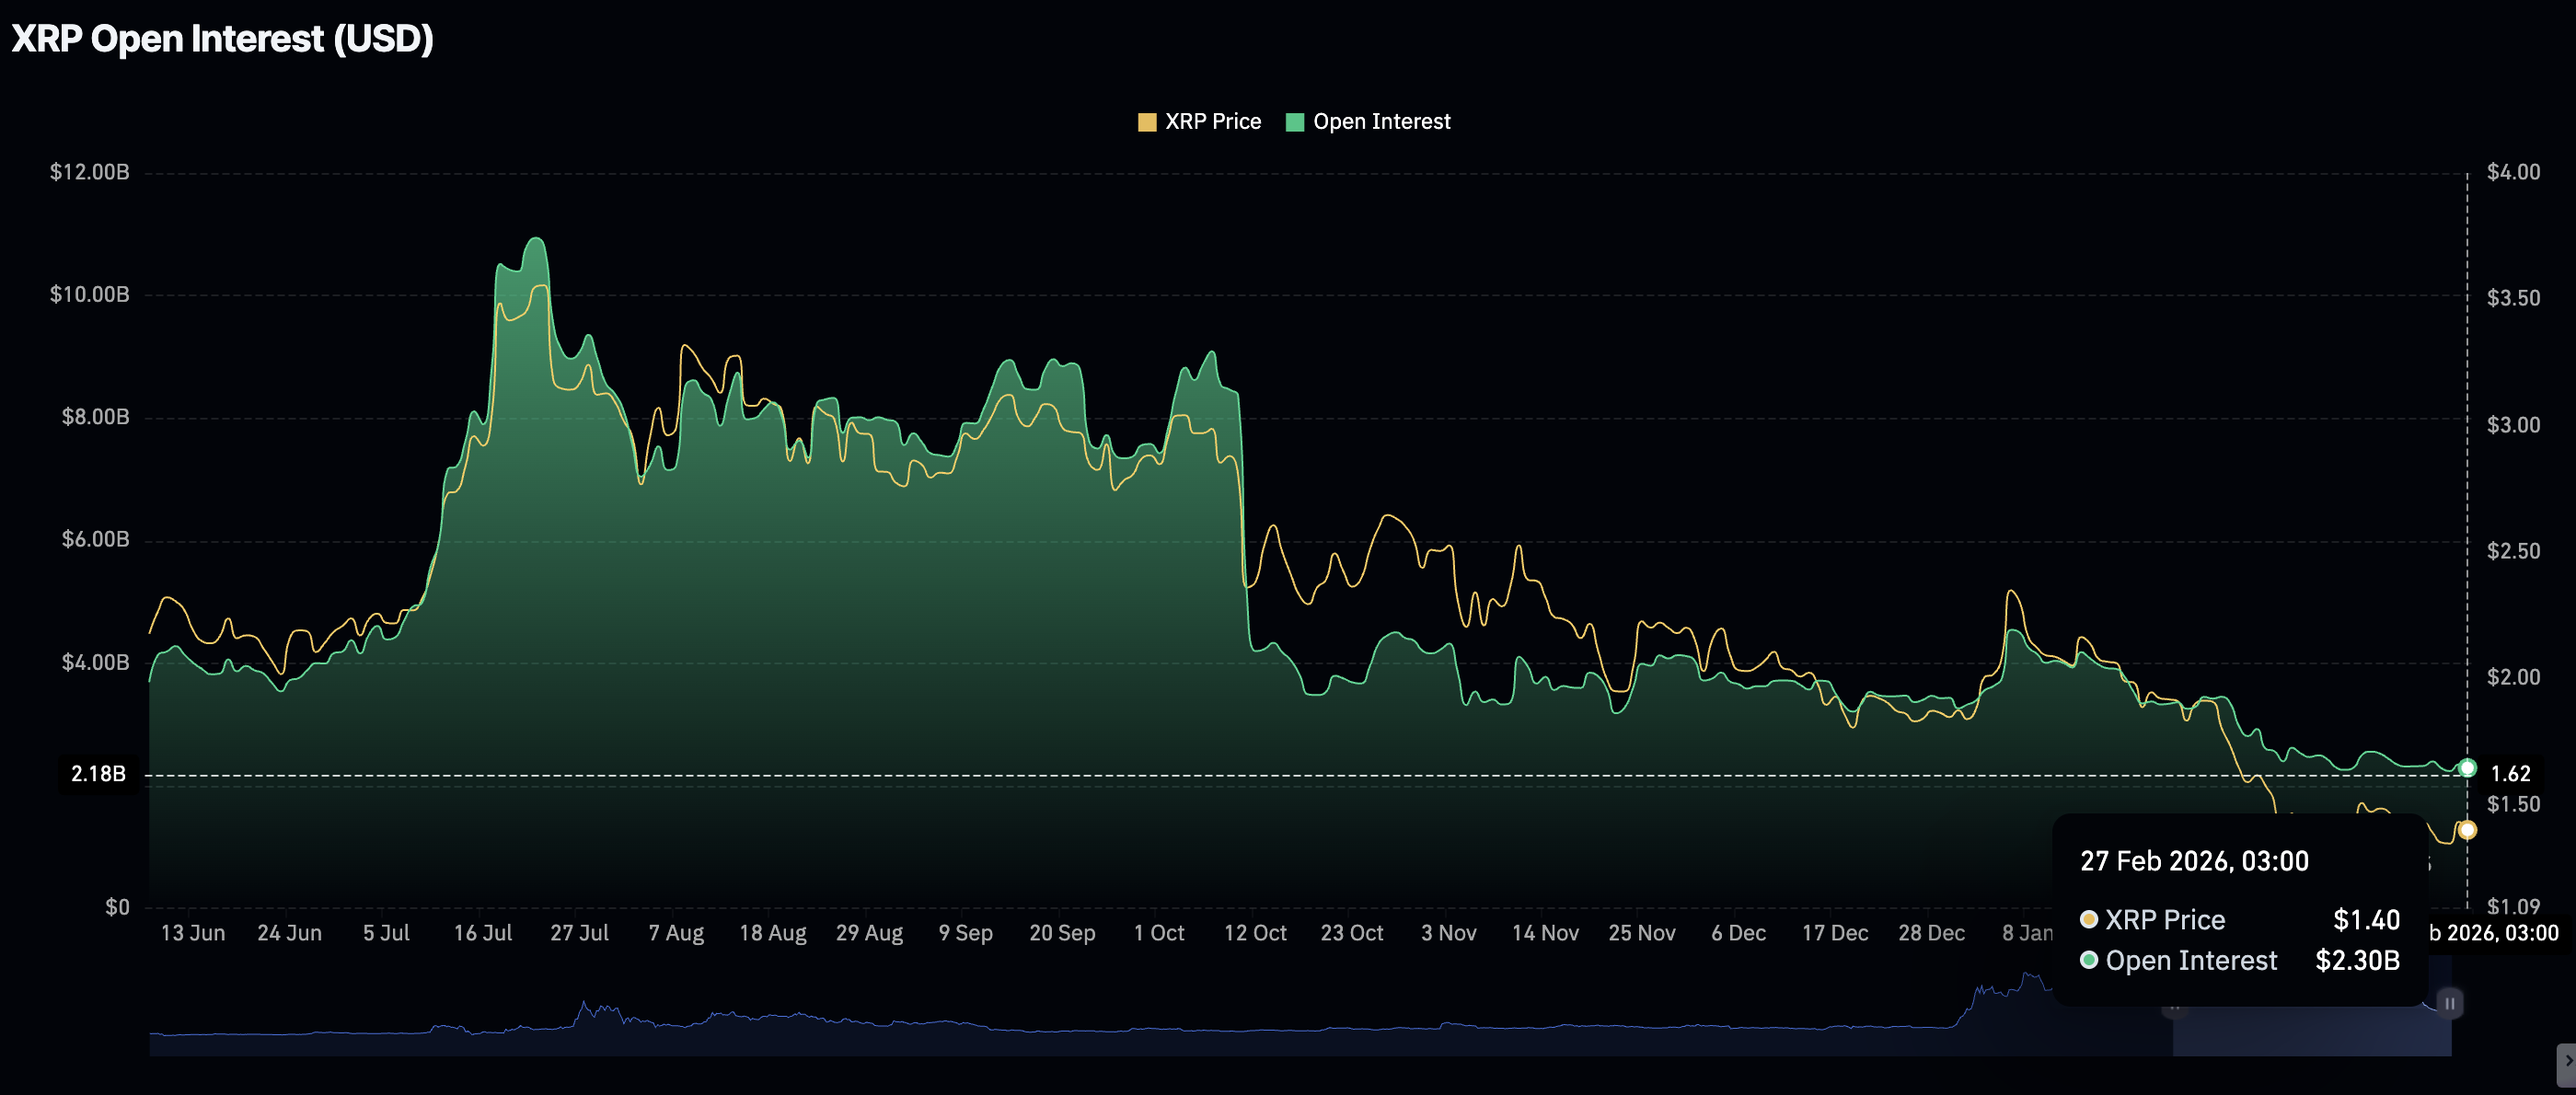
Chart of the day: Bitcoin stalls recovery
Bitcoin is trading around $67,000 after its intraday breakout stalled slightly above $68,000. The price remains well below the 50-day Exponential Moving Average (EMA) at $75,799, the 100-day EMA at $83,425 and the 200-day EMA at $91,005. All three moving averages are sloping downward, reinforcing the overall bearish trend.
The Relative Strength Index (RSI) near 41 remains below the 50 midline and is dropping on the daily chart, suggesting a cautious, mildly bearish-to-neutral near-term bias. Still, the Moving Average Convergence Divergence (MACD) line holds above the signal line on the same chart, with a widening histogram, suggesting improving upside momentum.
A decisive break above the psychological $70,000 threshold, almost aligning with Wednesday’s high, could open the door to a sustained breakout eyeing the February 8 high at $72,271.
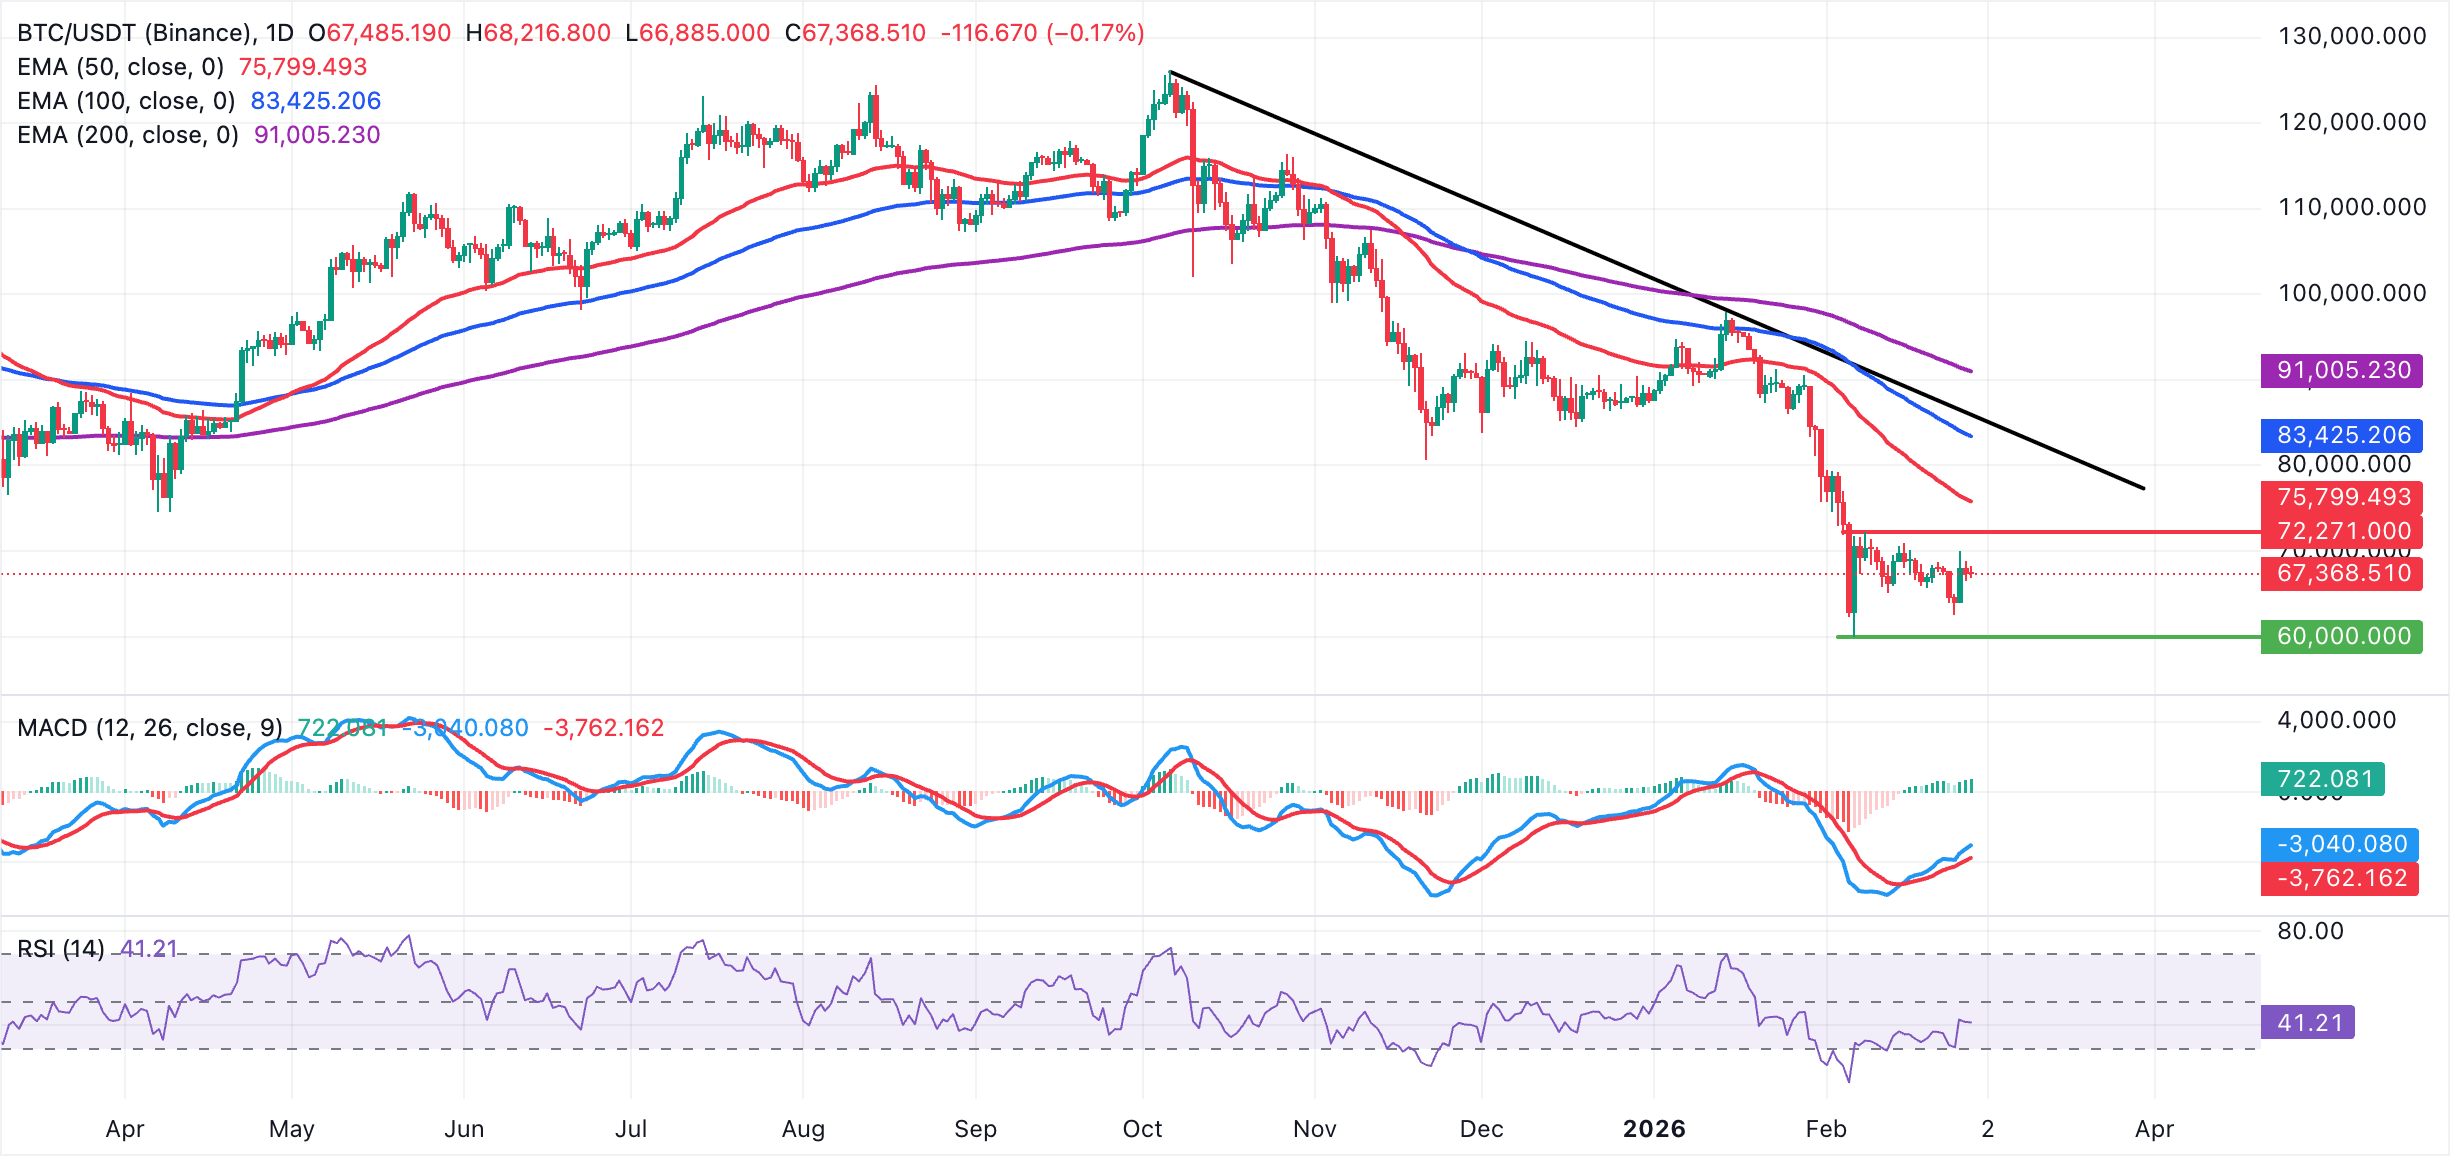
Meanwhile, immediate support is seen near $66,500, aligning with Thursday’s low, followed by stronger demand around the weekly low at $62,513. A break below this buyer congestion would expose the next downside area near $60,000, while holding above $66,500 keeps the door open for a breakout toward the overhead moving-average cluster.
Altcoins technical outlook: Ethereum, XRP uptrend falters as correction lingers
Ethereum is trading below the pivotal $2,000 level, affirming a near-term bearish bias while investors turn cautiously bullish after the token rebounded from its weekly low at $1,800.
The price also holds well below the descending 50-day, 100-day and 200-day EMAs, which still frame a broader downtrend. Meanwhile, the RSI at 41 on the daily chart aligns with a bearish-leaning trend. A daily close below $2,000 could limit bullish influence further and trigger another sell-off toward support at $1,800.
On the other hand, the MACD line holds above its signal while green histogram bars expand, suggesting building upside pressure. Decisively breaking above the $2,000 level would set the pace for gains toward Wednesday’s high at $2,148. From here, bulls will target the 50-day EMA at $2,362 and then the 100-day EMA at $2,706.
-1772190017679-1772190017681.png)
XRP, on the other hand, has slipped to trade around $1.40 – a move that aligns with the overall bearish trend, as evidenced by the falling 50-day EMA at $1.62, the 100-day EMA at $1.83 and the 200-day EMA at $2.06.
The RSI at 41 on the daily chart suggests that momentum is still largely bearish. A further decline in the RSI toward oversold territory would see sellers tighten their grip, increasing the odds of an extended correction to the weekly low at $1.31.
-1772189303468-1772189303471.png)
Still, the MACD indicator remains below its signal line, as green histogram bars stabilize, reinforcing a rather cautious bullish outlook. Traders will watch for a daily close above $1.40, which would likely pave the way for a breakout toward the February 6 high of $1.54.
Open Interest, funding rate FAQs
Higher Open Interest is associated with higher liquidity and new capital inflow to the market. This is considered the equivalent of increase in efficiency and the ongoing trend continues. When Open Interest decreases, it is considered a sign of liquidation in the market, investors are leaving and the overall demand for an asset is on a decline, fueling a bearish sentiment among investors.
Funding fees bridge the difference between spot prices and prices of futures contracts of an asset by increasing liquidation risks faced by traders. A consistently high and positive funding rate implies there is a bullish sentiment among market participants and there is an expectation of a price hike. A consistently negative funding rate for an asset implies a bearish sentiment, indicating that traders expect the cryptocurrency’s price to fall and a bearish trend reversal is likely to occur.
(The technical analysis of this story was written with the help of an AI tool.)
Author

John Isige
FXStreet
John Isige is a seasoned cryptocurrency journalist and markets analyst committed to delivering high-quality, actionable insights tailored to traders, investors, and crypto enthusiasts. He enjoys deep dives into emerging Web3 tren