Ethereum Weekly Price Forecast: US interest returns, but bearish outlook remains
- Ethereum's Coinbase Premium Index flipped positive during the week, reaching its highest level since mid-December.
- Ethereum's open interest rose by 500K ETH, but funding rates remain negative.
- ETH tilts toward the downside after seeing a rejection at the 20-day EMA and $2,108 resistance.

Ethereum saw renewed US interest this week, prompting prices to briefly reclaim $2,110 before facing downside pressure.
The Coinbase Premium Index, which measures US investors' sentiment by comparing the price of the ETH/USD pair on Coinbase to the ETH/USDT pair on Binance, has flipped positive. The index reached its highest level since mid-December, indicating that US traders who have been on the sidelines are slowly returning to action.
As a result, the index's 7-day moving average (7DMA) is also rising, but it remains below its neutral level. Historically, US sentiment often has a strong impact on prices after the index's 7DMA flips positive.
-1772227307315-1772227307316.png)
Similarly, US spot-listed ETH ETFs have seen three consecutive days of net inflows for the first time since mid-January. The products pulled in $157.1 million on Wednesday, but net inflows slowed to $6.5 million on Thursday.
The slight uptick in inflows comes amid strong selling activity in the products. Since October, ETH ETFs have shed $3.3 billion, largely driven by hedge fund selling as the basis began to collapse.
On the derivatives front, ETH's open interest grew by 500K ETH to 12.70 million ETH during the week, reaching its highest level this month as prices showed slight improvement.
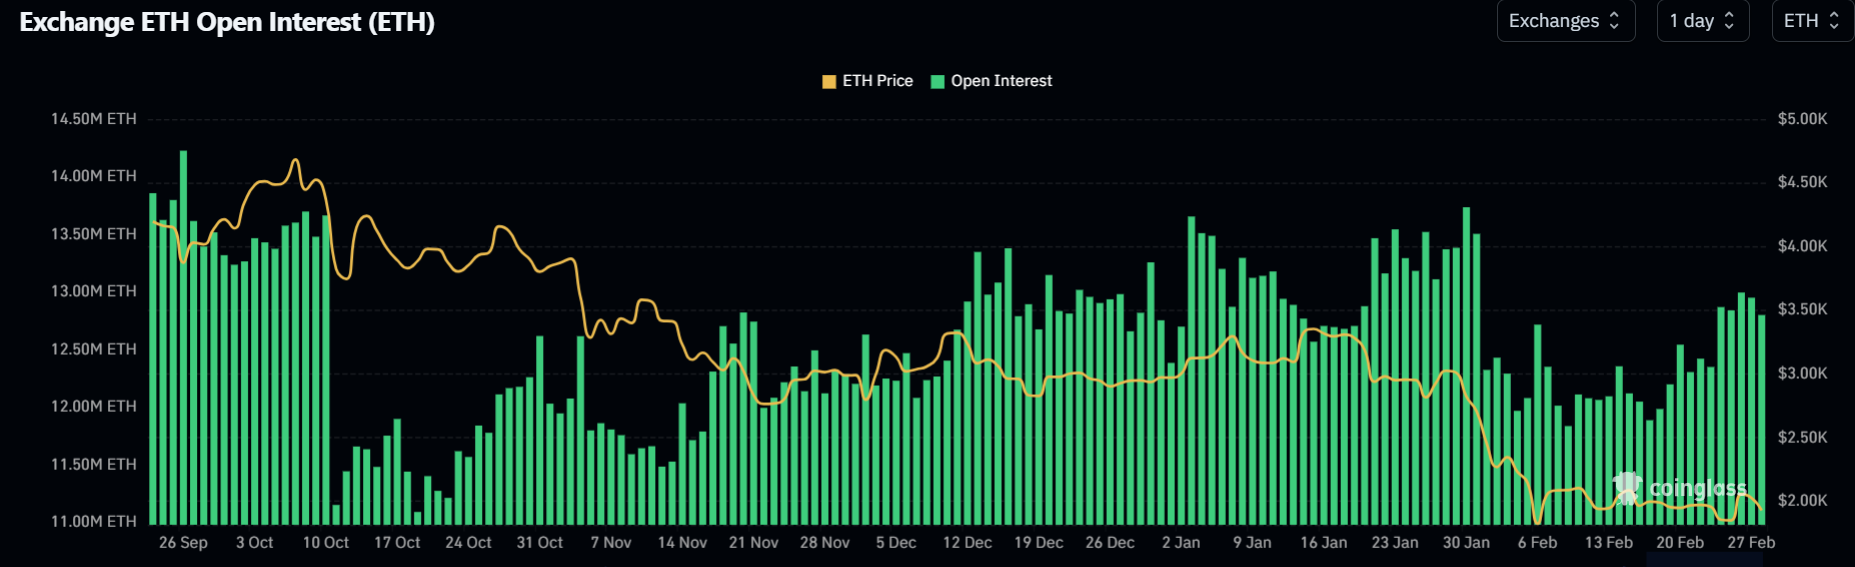
However, funding rates continue to post positive and negative flashes, indicating the market has yet to establish a clear direction.
Ethereum Price Forecast: ETH tilts toward downside after rejection at 20-day EMA
Ethereum saw $81.4 million in liquidations over the past 24 hours, led $65.5 million in long liquidations, per Coinglass data.
In the daily chart, ETH holds below the 20-day Exponential Moving Average (EMA) near $2,045, preserving a broader bearish structure despite the rebound from last week’s lows. The daily Relative Strength Index (RSI) has eased back toward 39 after recovering from oversold territory, indicating fading downside momentum but not yet a shift to bullish pressure. The Stochastic Oscillator (Stoch) has rolled over from overbought levels seen earlier this week, reinforcing the view that the recent bounce is corrective within a dominant downtrend.
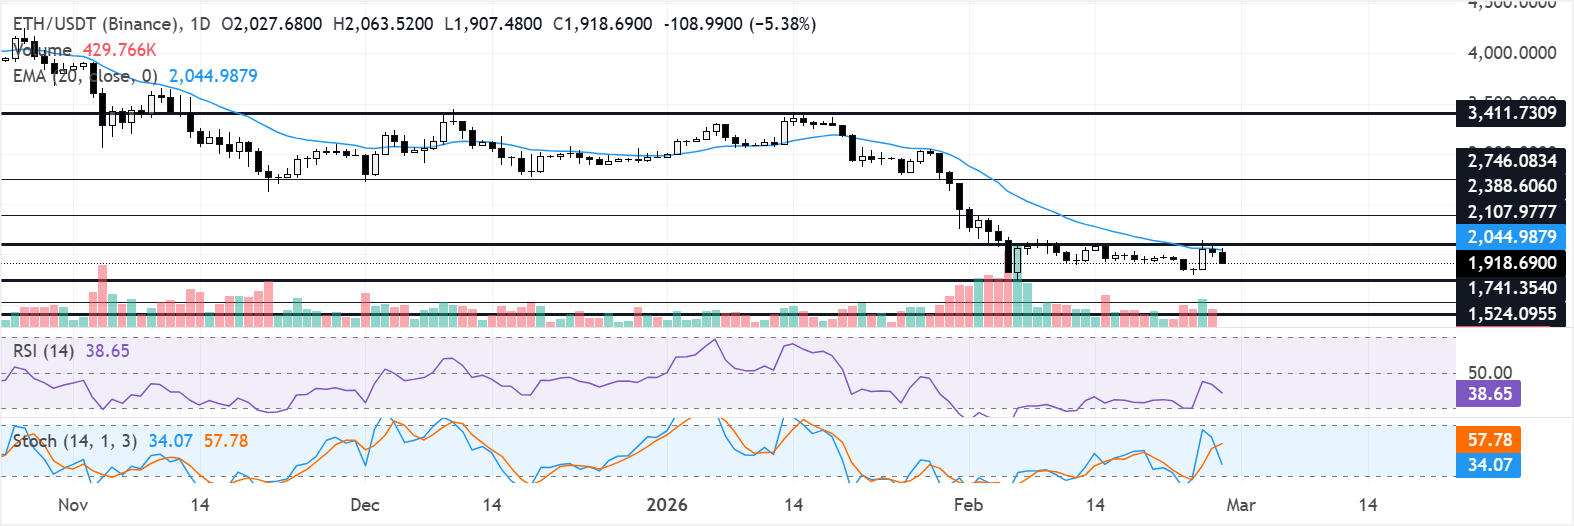
Immediate resistance emerges at $2,108, where the 20-day EMA is converging with a horizontal cap, followed by $2,389 and then $2,746. A daily close above $2,108 would be needed to weaken the current bearish bias and open the way toward the higher resistance band. On the downside, initial support is seen at $1,741, ahead of $1,524, with a deeper extension exposing a more distant support at the $1,405 area. As long as price remains trapped below $2,108, rallies face selling interest and risk a return to the lower supports.
In the weekly chart, the near-term bias stays bearish as price holds below the 20-week EMA, which is rolling over above $2,800 and confirming a maturing downtrend from the $4,700 area.
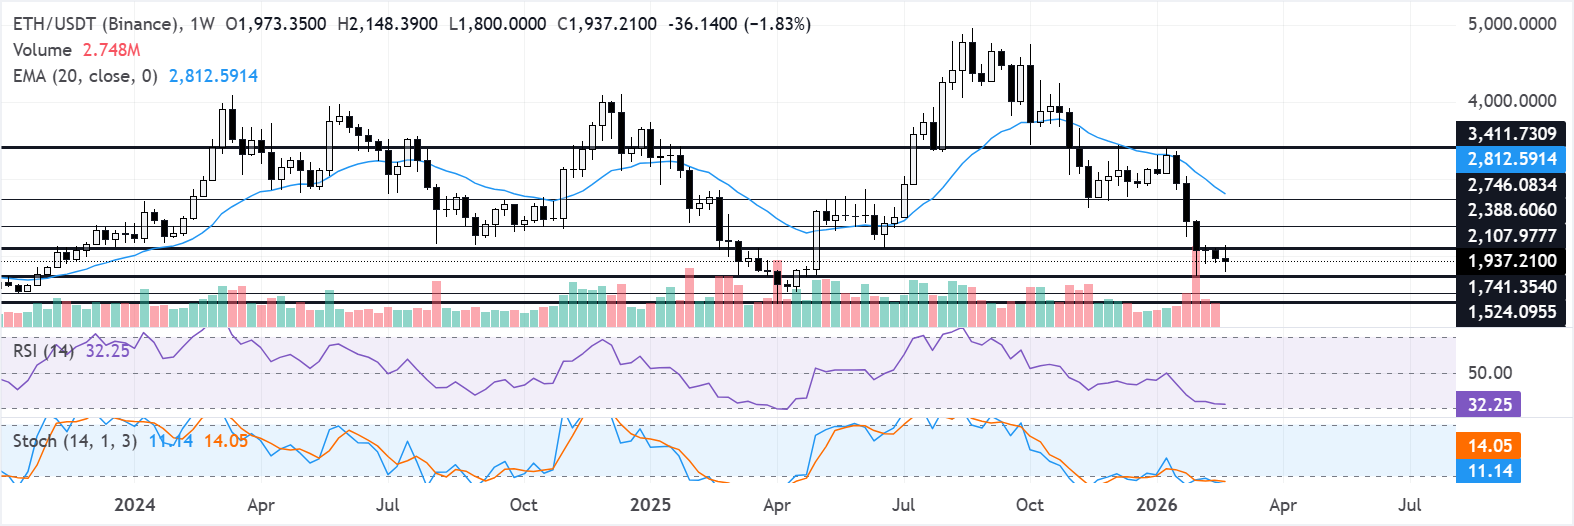
Weekly RSI hovers near 32, holding below the 50 midline and signaling persistent downside momentum rather than a completed oversold washout, while the Stochastic oscillator remains depressed in the low teens, showing weak buying interest after the recent slide.
ETH is trading around $1,920, down over 5% in the past 24 hours.
(The technical analysis of this story was written with the help of an AI tool.)
Author

Michael Ebiekutan
FXStreet
With a deep passion for web3 technology, he's collaborated with industry-leading brands like Mara, ITAK, and FXStreet in delivering groundbreaking reports on web3's transformative potential across diverse sectors. In addition to