Stellar Price Forecast: XLM mixed sentiment caps recovery
- Stellar price hovers at $0.170 on Tuesday after being rejected by the descending trendline over the last two days.
- Derivatives data back bearish sentiment as short bets are rising alongside negative funding rates.
- The technical outlook suggests a potential recovery, as momentum indicators indicate fading bearish strength.

Stellar (XLM) price remains under pressure, trading at $0.170 on Tuesday after failing to close above the key resistance on Sunday. The derivatives metric supports the bearish sentiment, with XLM’s short bets rising among traders and funding rates turning negative. However, the improvement in momentum indicators suggests a potential recovery if XLM breaks key resistance levels.
Derivatives data support a bearish bias
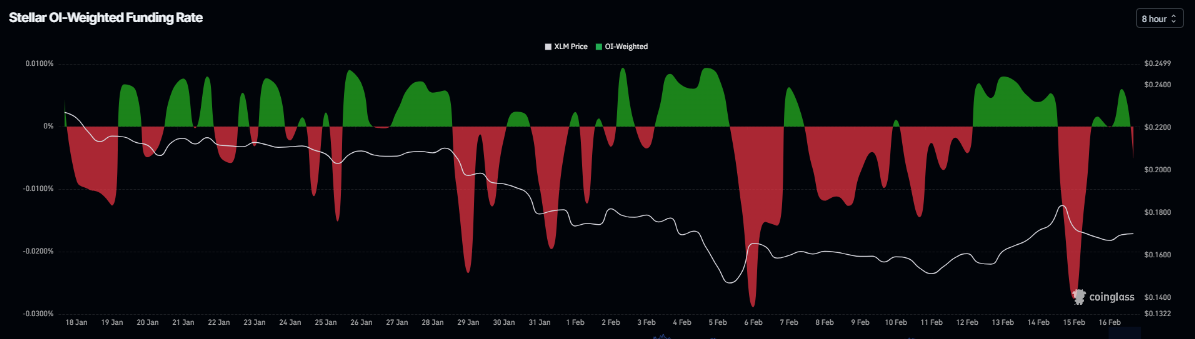
CoinGlass’s OI-Weighted Funding Rate data shows that the number of traders betting that the price of XLM will slide further is higher than those anticipating a price increase.
The metric turned negative on Tuesday and stands at -0.0050%. The negative ratio suggests that shorts are paying longs, suggesting bearish sentiment toward XLM.
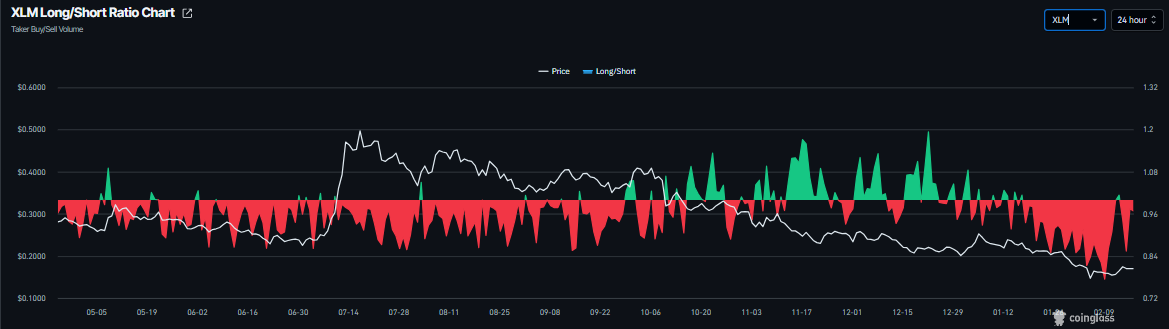
In addition, CoinGlass’ long-to-short ratio for XLM reads 0.96 on Tuesday. The ratio below one suggests that more traders are betting on Stellar’s price to fall.
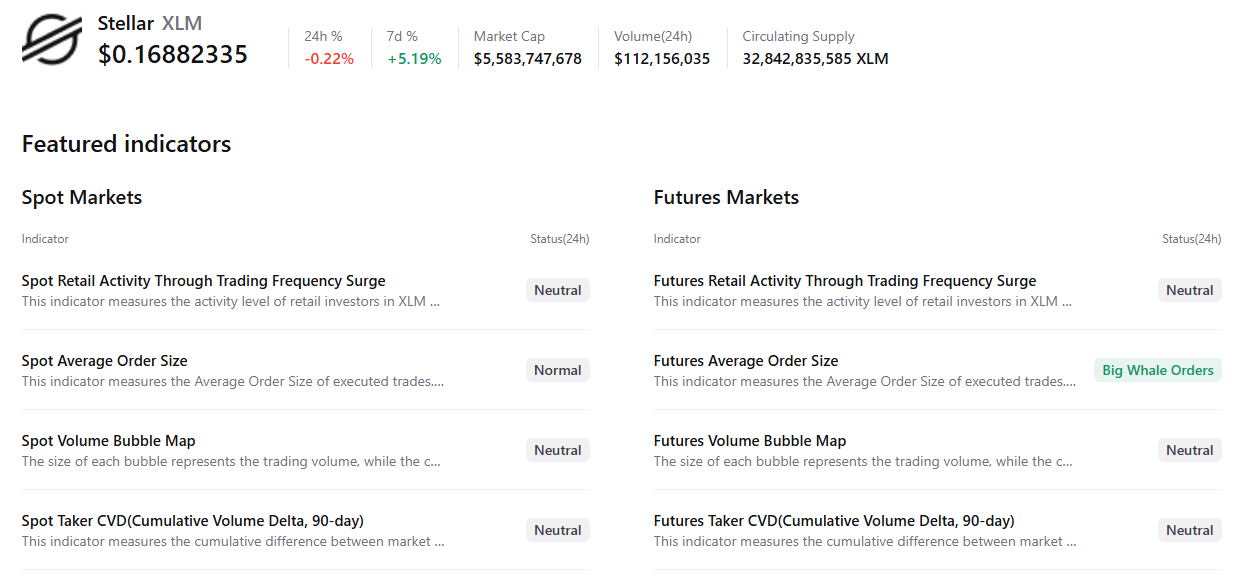
Despite bearish sentiment in the derivatives market, XLM’s CryptoQuant summary data indicate neutral conditions with early signs of bullishness. Activity across both spot and futures markets remains largely balanced, reflecting indecision among traders. However, the presence of large whale orders in the futures market suggests a slightly optimistic outlook for XLM.
Stellar Price Forecast: XLM momentum indicators show fading bearish strength
Stellar price failed to close above the descending trendline on Sunday and declined slightly the next day. As of writing on Tuesday, XLM is trading at $0.168.
If XLM breaks and closes above the descending trendline, it could extend the advance toward the 50-day Exponential Moving Average (EMA) at $0.194.
The Relative Strength Index (RSI) reads 42, rebounding from the oversold conditions last week and is heading toward the neutral level of 50, indicating fading bearish momentum. However, for the recovery rally to be sustained, the RSI must move above the neutral level. The Moving Average Convergence Divergence (MACD) also showed a bullish crossover on Saturday, further supporting the recovery thesis.
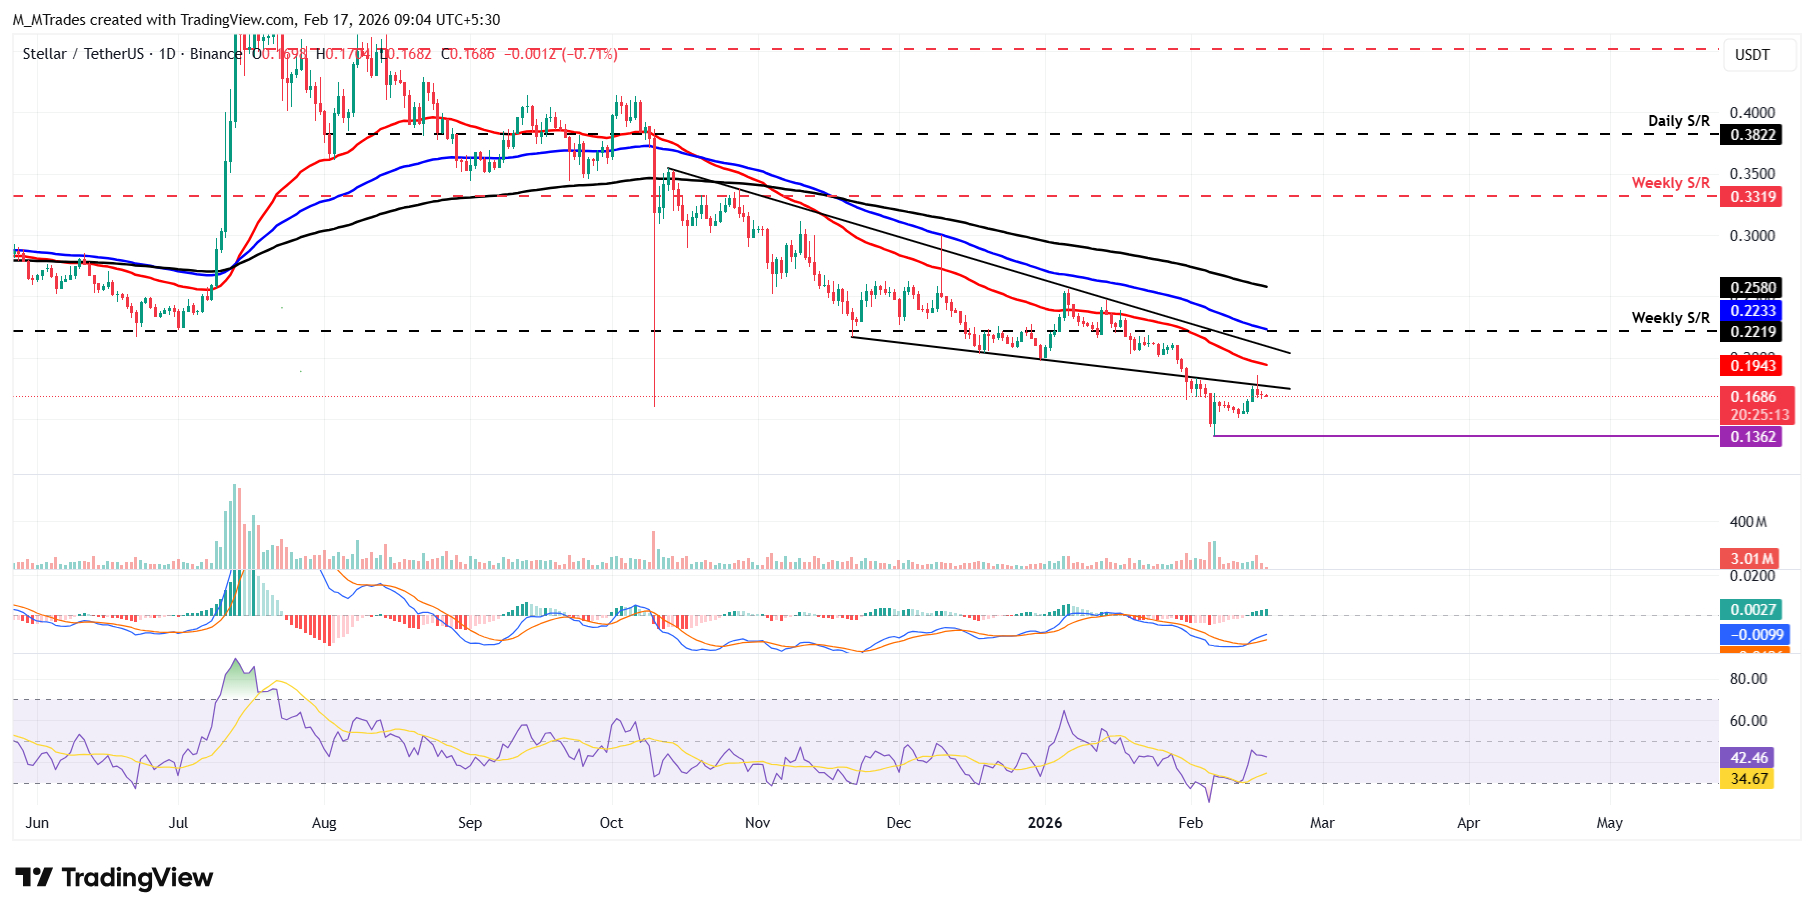
However, if XLM continues its correction, it could extend the decline toward the February 6 low at $0.136.
Author

Manish Chhetri
FXStreet
Manish Chhetri is a crypto specialist with over four years of experience in the cryptocurrency industry.