|

Pi Network Price Forecast: PI rallies ahead of its first anniversary 

  • Pi Network is up roughly 5% on Tuesday, with bulls targeting a move above the 50-day EMA.
  • PiScan data indicate that large wallet investors have acquired nearly 4 million PI tokens over the last 24 hours.
  • The technical outlook for Pi Network centers on the 50-day EMA, which serves as the immediate resistance level.

Pi Network (PI) trades above $0.1800 at the time of writing on Tuesday, recording nearly 5% gains so far. On-chain data indicate that large wallet investors, commonly known as whales, have accumulated approximately 4 million PI tokens over the last 24 hours. Technically, Pi Network could extend its tally with a decisive breakout of the 50-day Exponential Moving Average (EMA). 

Pi Network gains demand ahead of first release anniversary

Piscan data shows two large value withdrawals of 1.99 million PI tokens each over the last 24 hours, reflecting heightened demand from whales. The sudden increase in whale activity aligns with the upcoming first anniversary of the open-net release on Friday (February 20). 
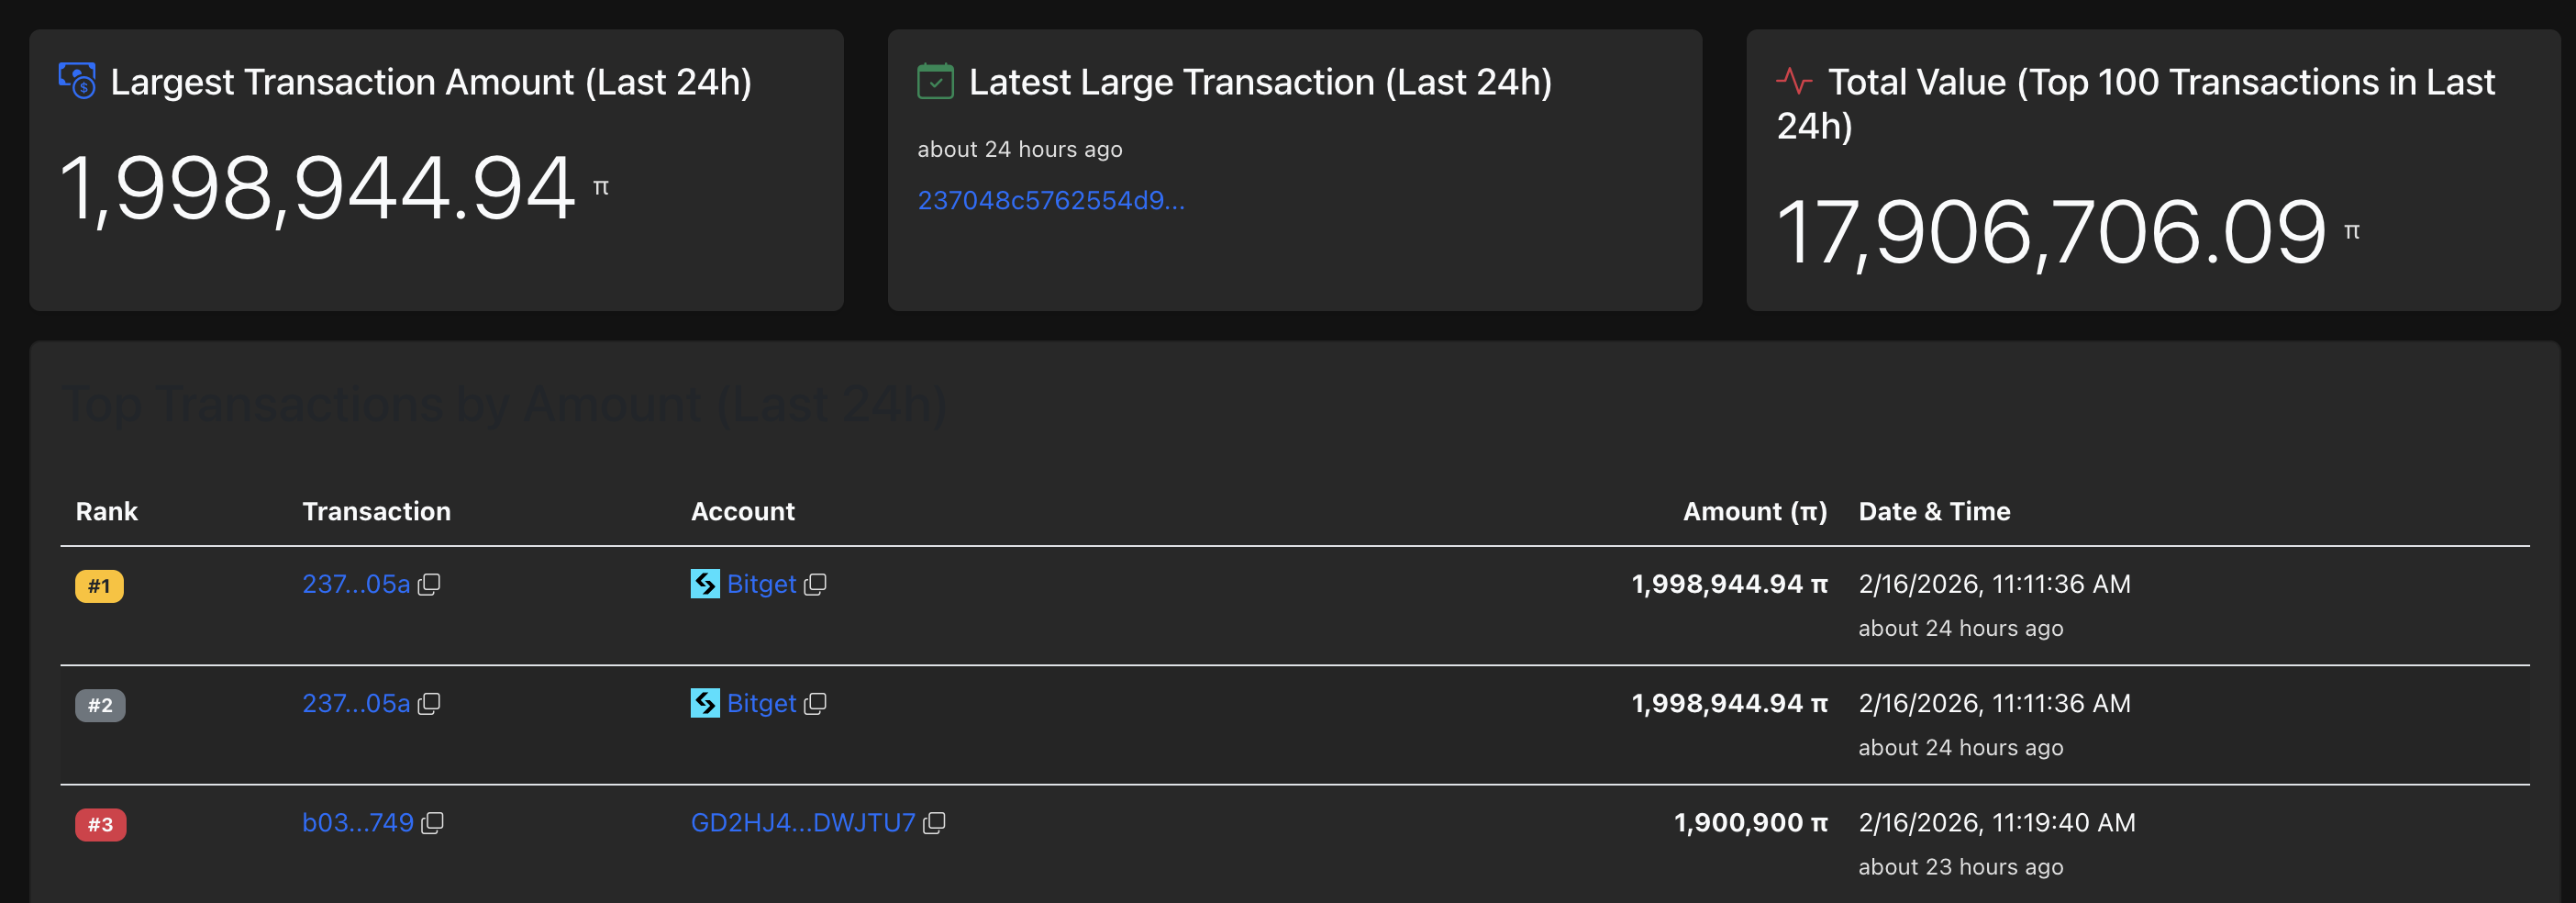
Pi Network transactions. Source: PiScan

Pi Network eyes extend gains amid rising bullish momentum

Pi Network has shown a sharp 20% recovery since Thursday, bouncing off the S1 Pivot Point at $0.1327. The briskly V-shaped recovery tests the 50-day EMA at 0.1767 with bulls focusing on a potential breakout. 

A decisive daily close above this level could confirm the bullish shift and extend the rally to the support-turned-resistance level, aligning with the October 11 low at $0.1919. 

The technical indicators on the daily chart remain bullish. The Relative Strength Index (RSI) at 60 rises above the midline with more upside before reaching the overbought zone. At the same time, the Moving Average Convergence Divergence (MACD) shows a steady upward trend toward the zero line as positive histograms widen, suggesting increasing bullish momentum. 
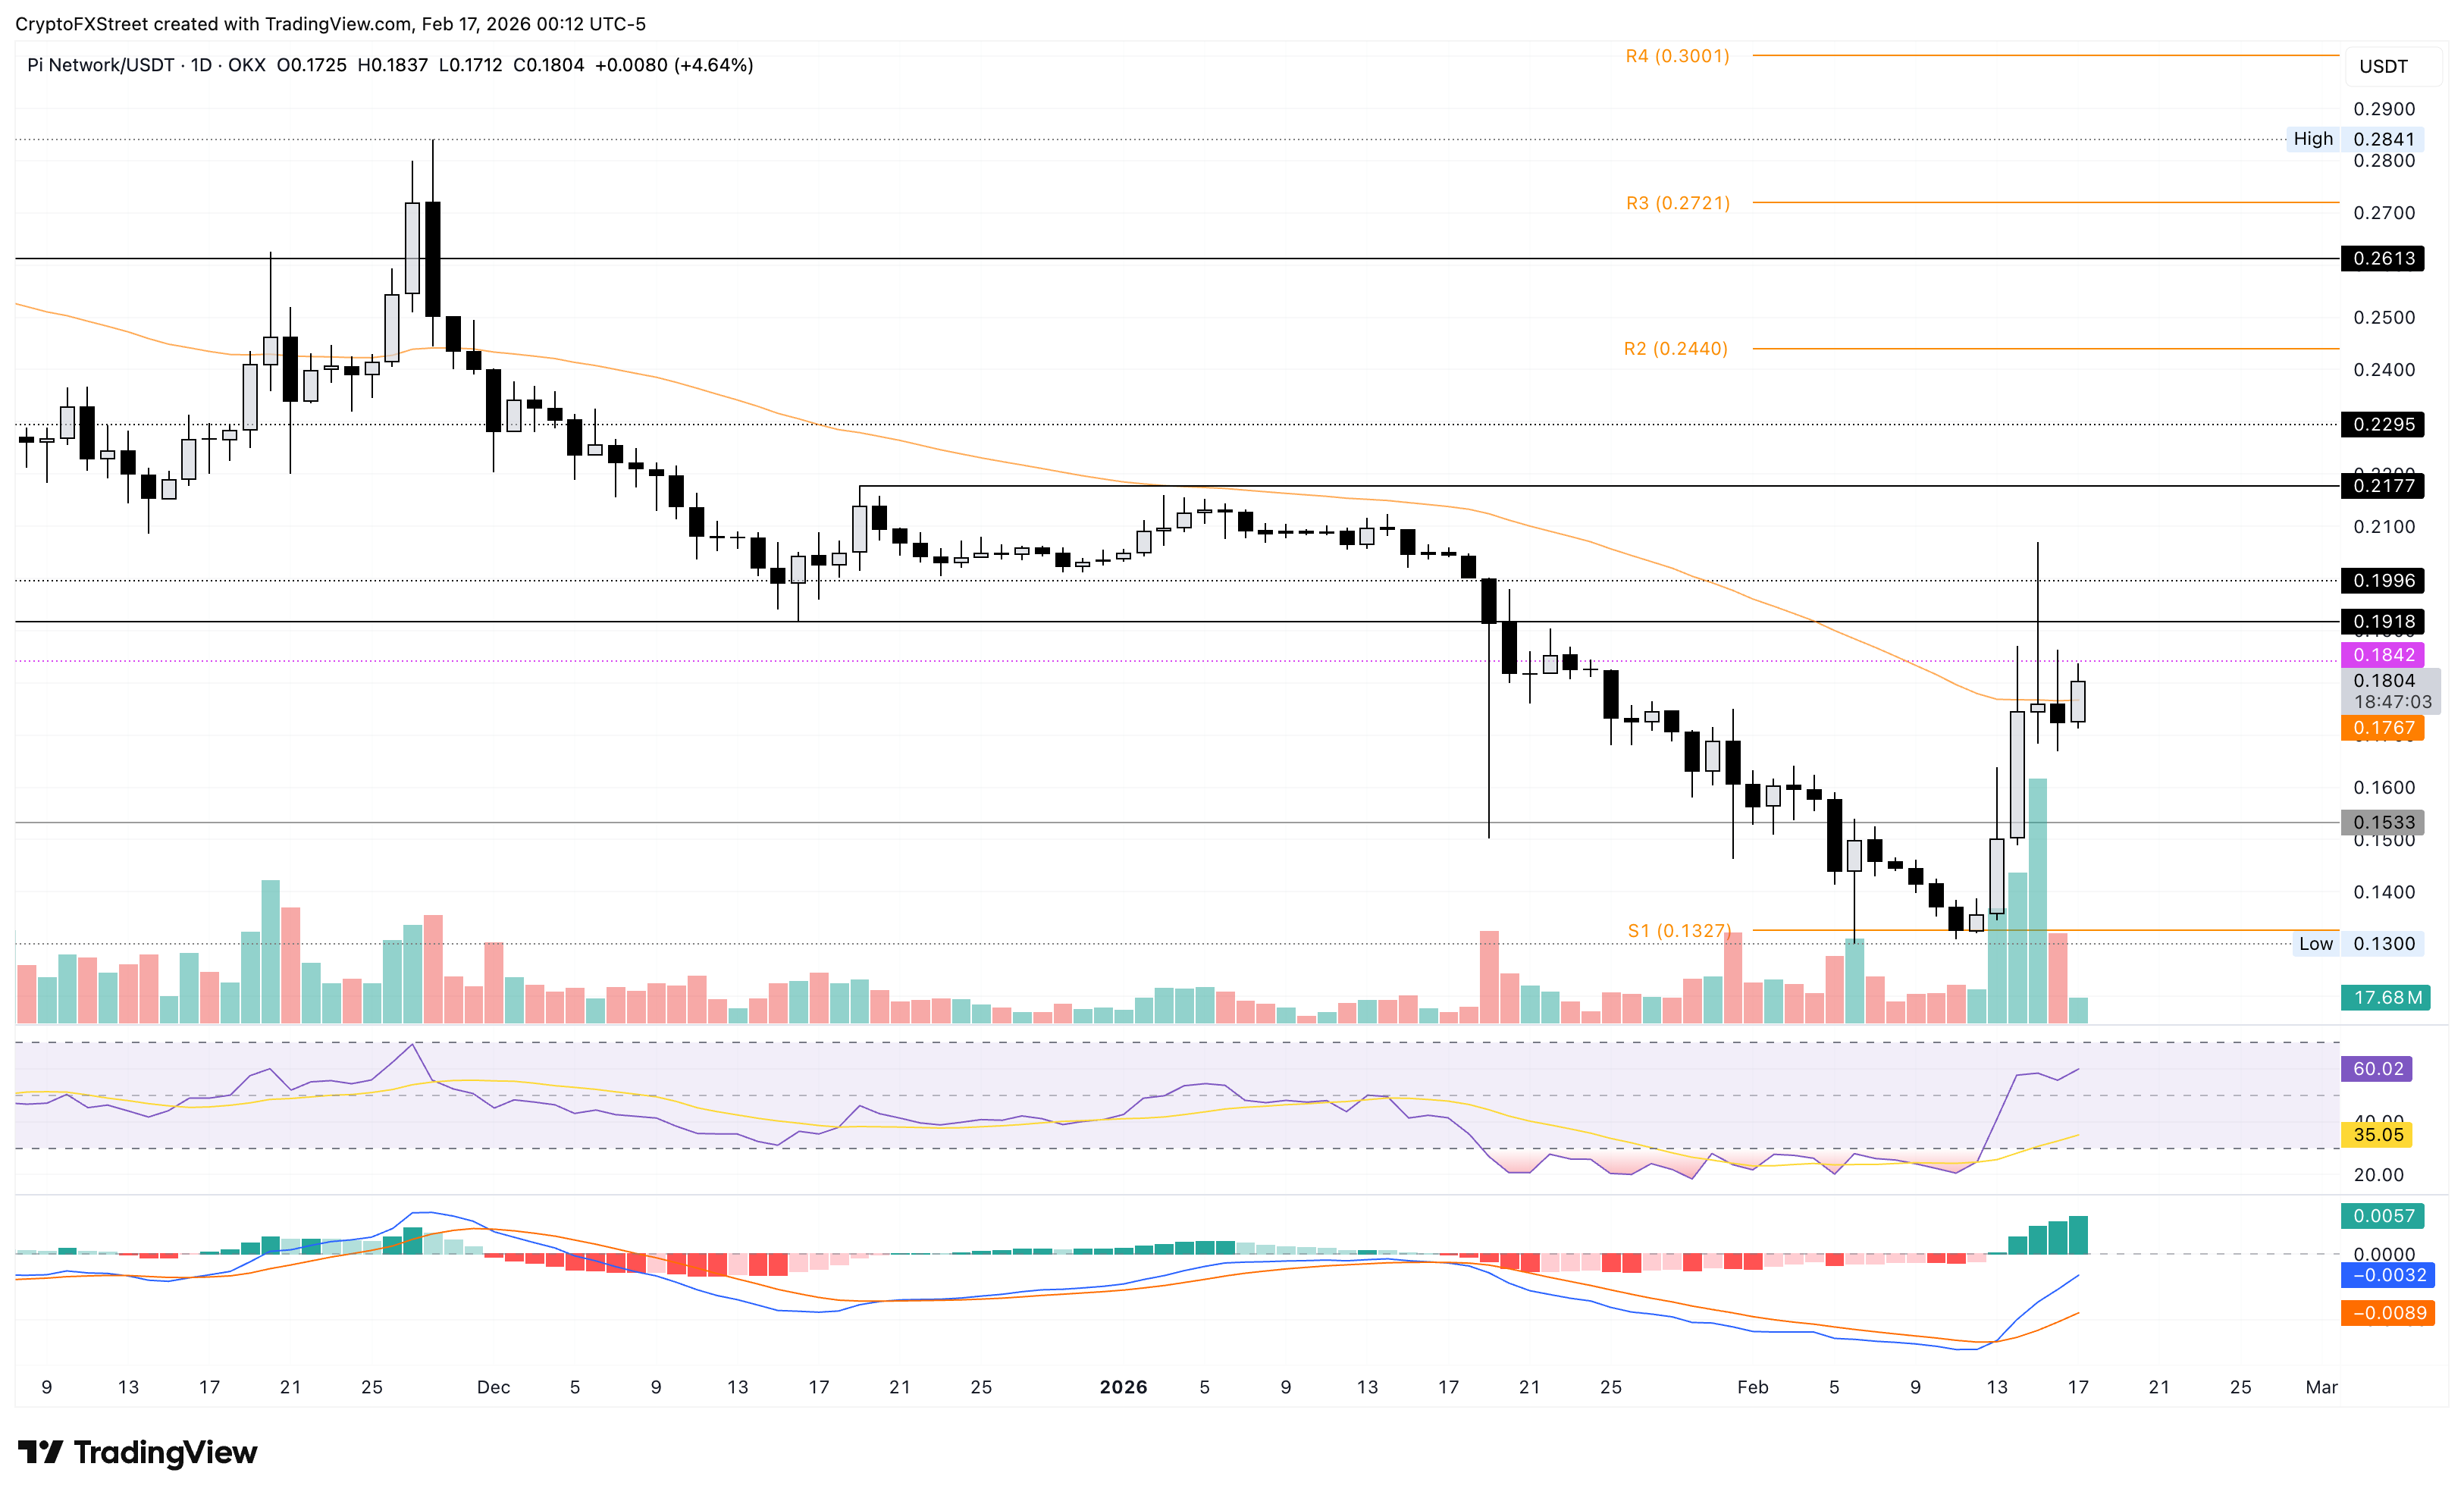
PI/USDT daily price chart.

On the flip side, a close below $0.1767 could cap bullish momentum, likely leading to a retest of the October 10 low at $0.1533. 

Author

Vishal Dixit

Vishal Dixit

FXStreet

Vishal Dixit holds a B.Sc. in Chemistry from Wilson College but found his true calling in the world of crypto.


More from Vishal Dixit
Share:

Editor's Picks

Bitcoin Weekly Forecast: BTC retreats as macro headwinds grow
Bitcoin (BTC) remains under pressure, down over 4% this week and trading around $76,900 at the time of writing on Friday. Institutional demand shows signs of weakness as spot BTC Exchange Traded Funds (ETFs) are on track to end their three-week inflow streak, recording nearly $500 million in net outflows through Thursday.
XRP falls toward key support as macro uncertainty, weak momentum cap recovery
Ripple (XRP) falls below $1.33 on Friday, marking the third consecutive day of declines. The token continues to track the broader cryptocurrency market downturn, with investors closely monitoring heightened macroeconomic uncertainty ahead of the United States (US) Consumer Price Index (CPI) release and next week’s Federal Reserve (Fed) monetary policy decision.
Crypto Today: Bitcoin, Ethereum, XRP stabilize at lower levels amid ETF outflows and macroeconomic risks
The broader cryptocurrency market is rising on Friday, with Bitcoin (BTC) trading above $77,000 after testing lower support near $76,500. Ethereum (ETH) shows signs of stability, hovering above the support provided at $2,400 despite capped upside at $2,500. Meanwhile, Ripple (XRP) holds above $1.33 after three straight days of declines, reflecting growing headwinds due to macroeconomic uncertainty.
Bitcoin pulls back as another golden cross fails to deliver
Earlier this week, Bitcoin formed a golden cross, a technical signal that occurs when the price’s 50-day moving average rises above the 200-day moving average and is conventionally viewed as a precursor to a bullish rally. Historically, however, that’s often not been the case.
Bitcoin: BTC retreats as macro headwinds grow
Bitcoin (BTC) remains under pressure, down over 4% this week and trading around $76,900 at the time of writing on Friday. Institutional demand shows signs of weakness as spot BTC Exchange Traded Funds (ETFs) are on track to end their three-week inflow streak, recording nearly $500 million in net outflows through Thursday.

