Jupiter Price Forecast: JUP rises on native SOL staking, TVL rebound
- Jupiter is up nearly 3% on Tuesday, approaching a crucial resistance level.
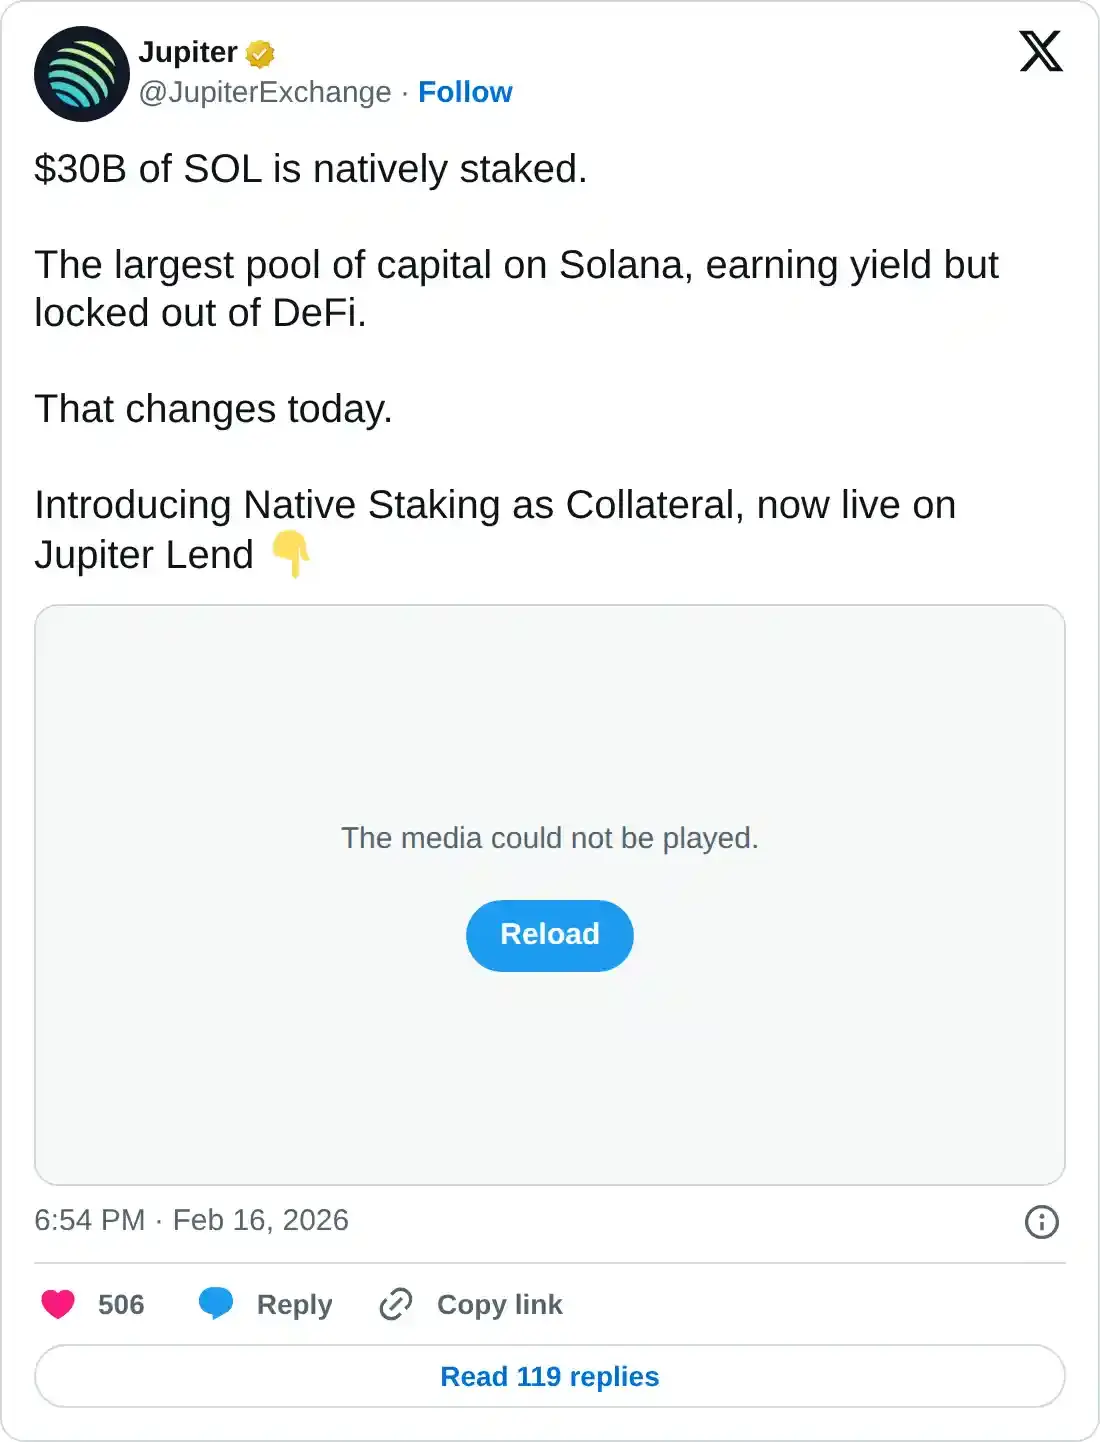
- Jupiter announced native SOL staking, opening doors to over $30 billion of staked SOL tokens.
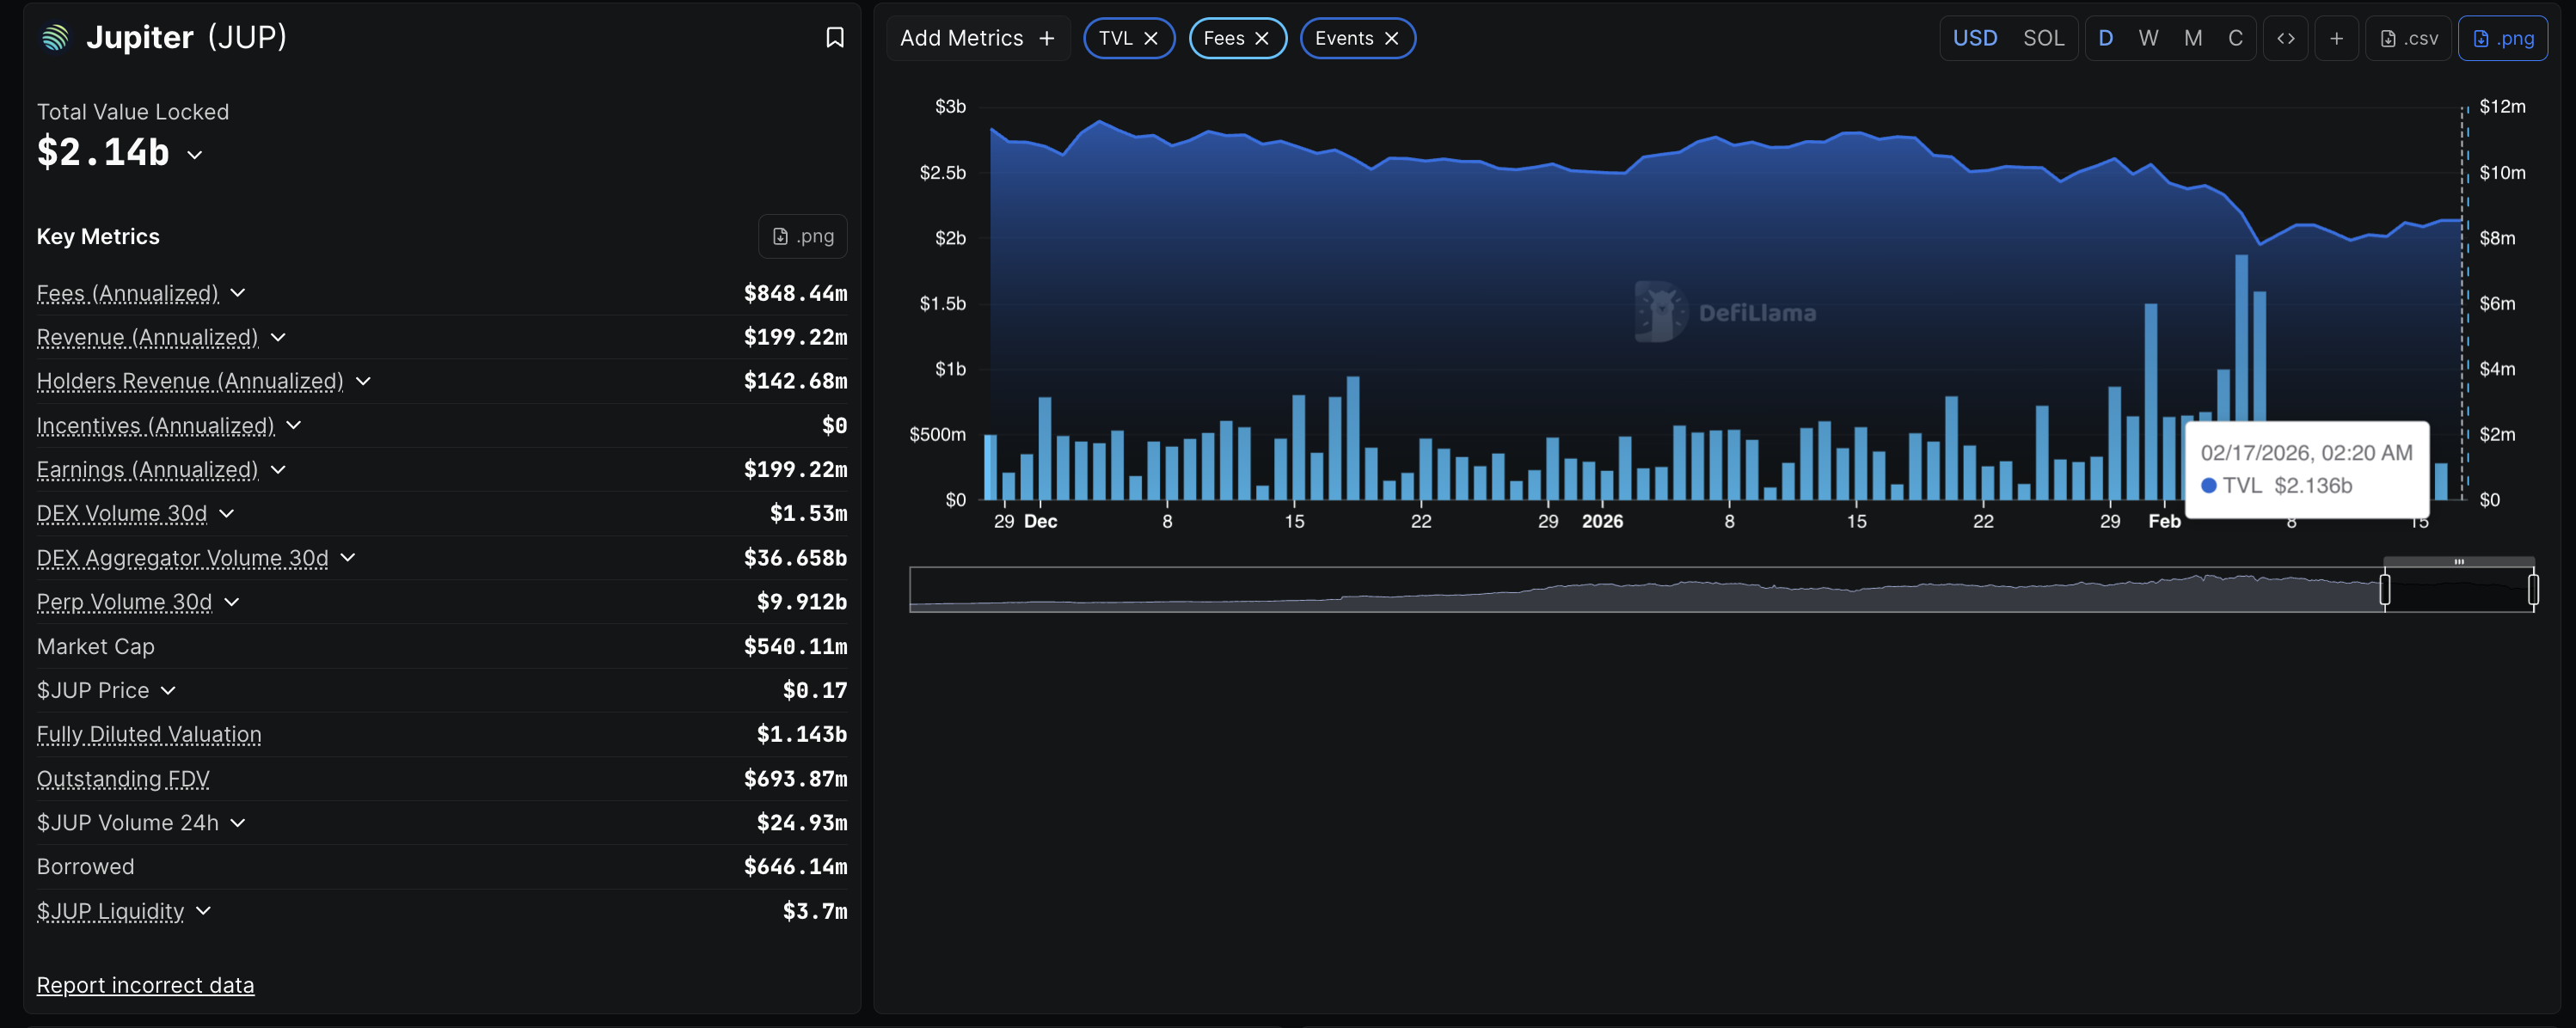
- DefiLlama data show TVL rebounding above $2 billion, suggesting renewed short-term demand.

Jupiter (JUP) edges higher by 3% at press time on Tuesday, approaching the $0.1700 level. The lending protocol announced native staking as collateral, allowing users to borrow against natively staked SOL on certain vaults. The Total Value Locked (TVL) on Jupiter has been steadily increasing above $2 billion, suggesting renewed user interest.
Jupiter introduces native staking as Collateral, TVL rises
Jupiter, a decentralized application built on Solana and focused on lending, announced native staking, which allows users to lend SOL against natively staked positions at up to 87% loan-to-value. The service is available to six validators and their vaults, including Jupiter (nsJUPITER), Helius (nsHELIUS), Nansen (nsNANSEN), Blueshift (nsSHIFT), Kiln (nsKILN), and Temporal (nsTEMPORAL). This allows users to expand the utility of natively staked SOL and bypass the need for Liquid Staked Tokens (LSTs).
DeFiLlama data shows the TVL on Jupiter stands at $2.14 billion on Tuesday, up from $1.95 billion on February 6. This reflects an increase in user deposits on Jupiter, indicating fresh inflow and user interest.
Technical outlook: Will JUP extend its rally above $0.17?
Jupiter is trading significantly below the 50-day and 200-day Exponential Moving Averages (EMAs), suggesting a prevailing downward bias. Still, the short-term V-shaped recovery in JUP approaches the $0.1695 resistance level, which previously capped gains on February 6.
A decisive close above this level would likely extend the rally to the 50-day EMA at $0.1888, followed by a higher zone at $0.2408, last rested on January 14.
The technical indicators on the daily chart suggest a bullish shift in trend momentum. The Relative Strength Index (RSI) is at 47, sloping upwards toward the midline as selling pressure wanes. At the same time, the Moving Average Convergence Divergence (MACD) rises above the signal line after a crossover on Sunday, indicating a rise in bullish momentum.
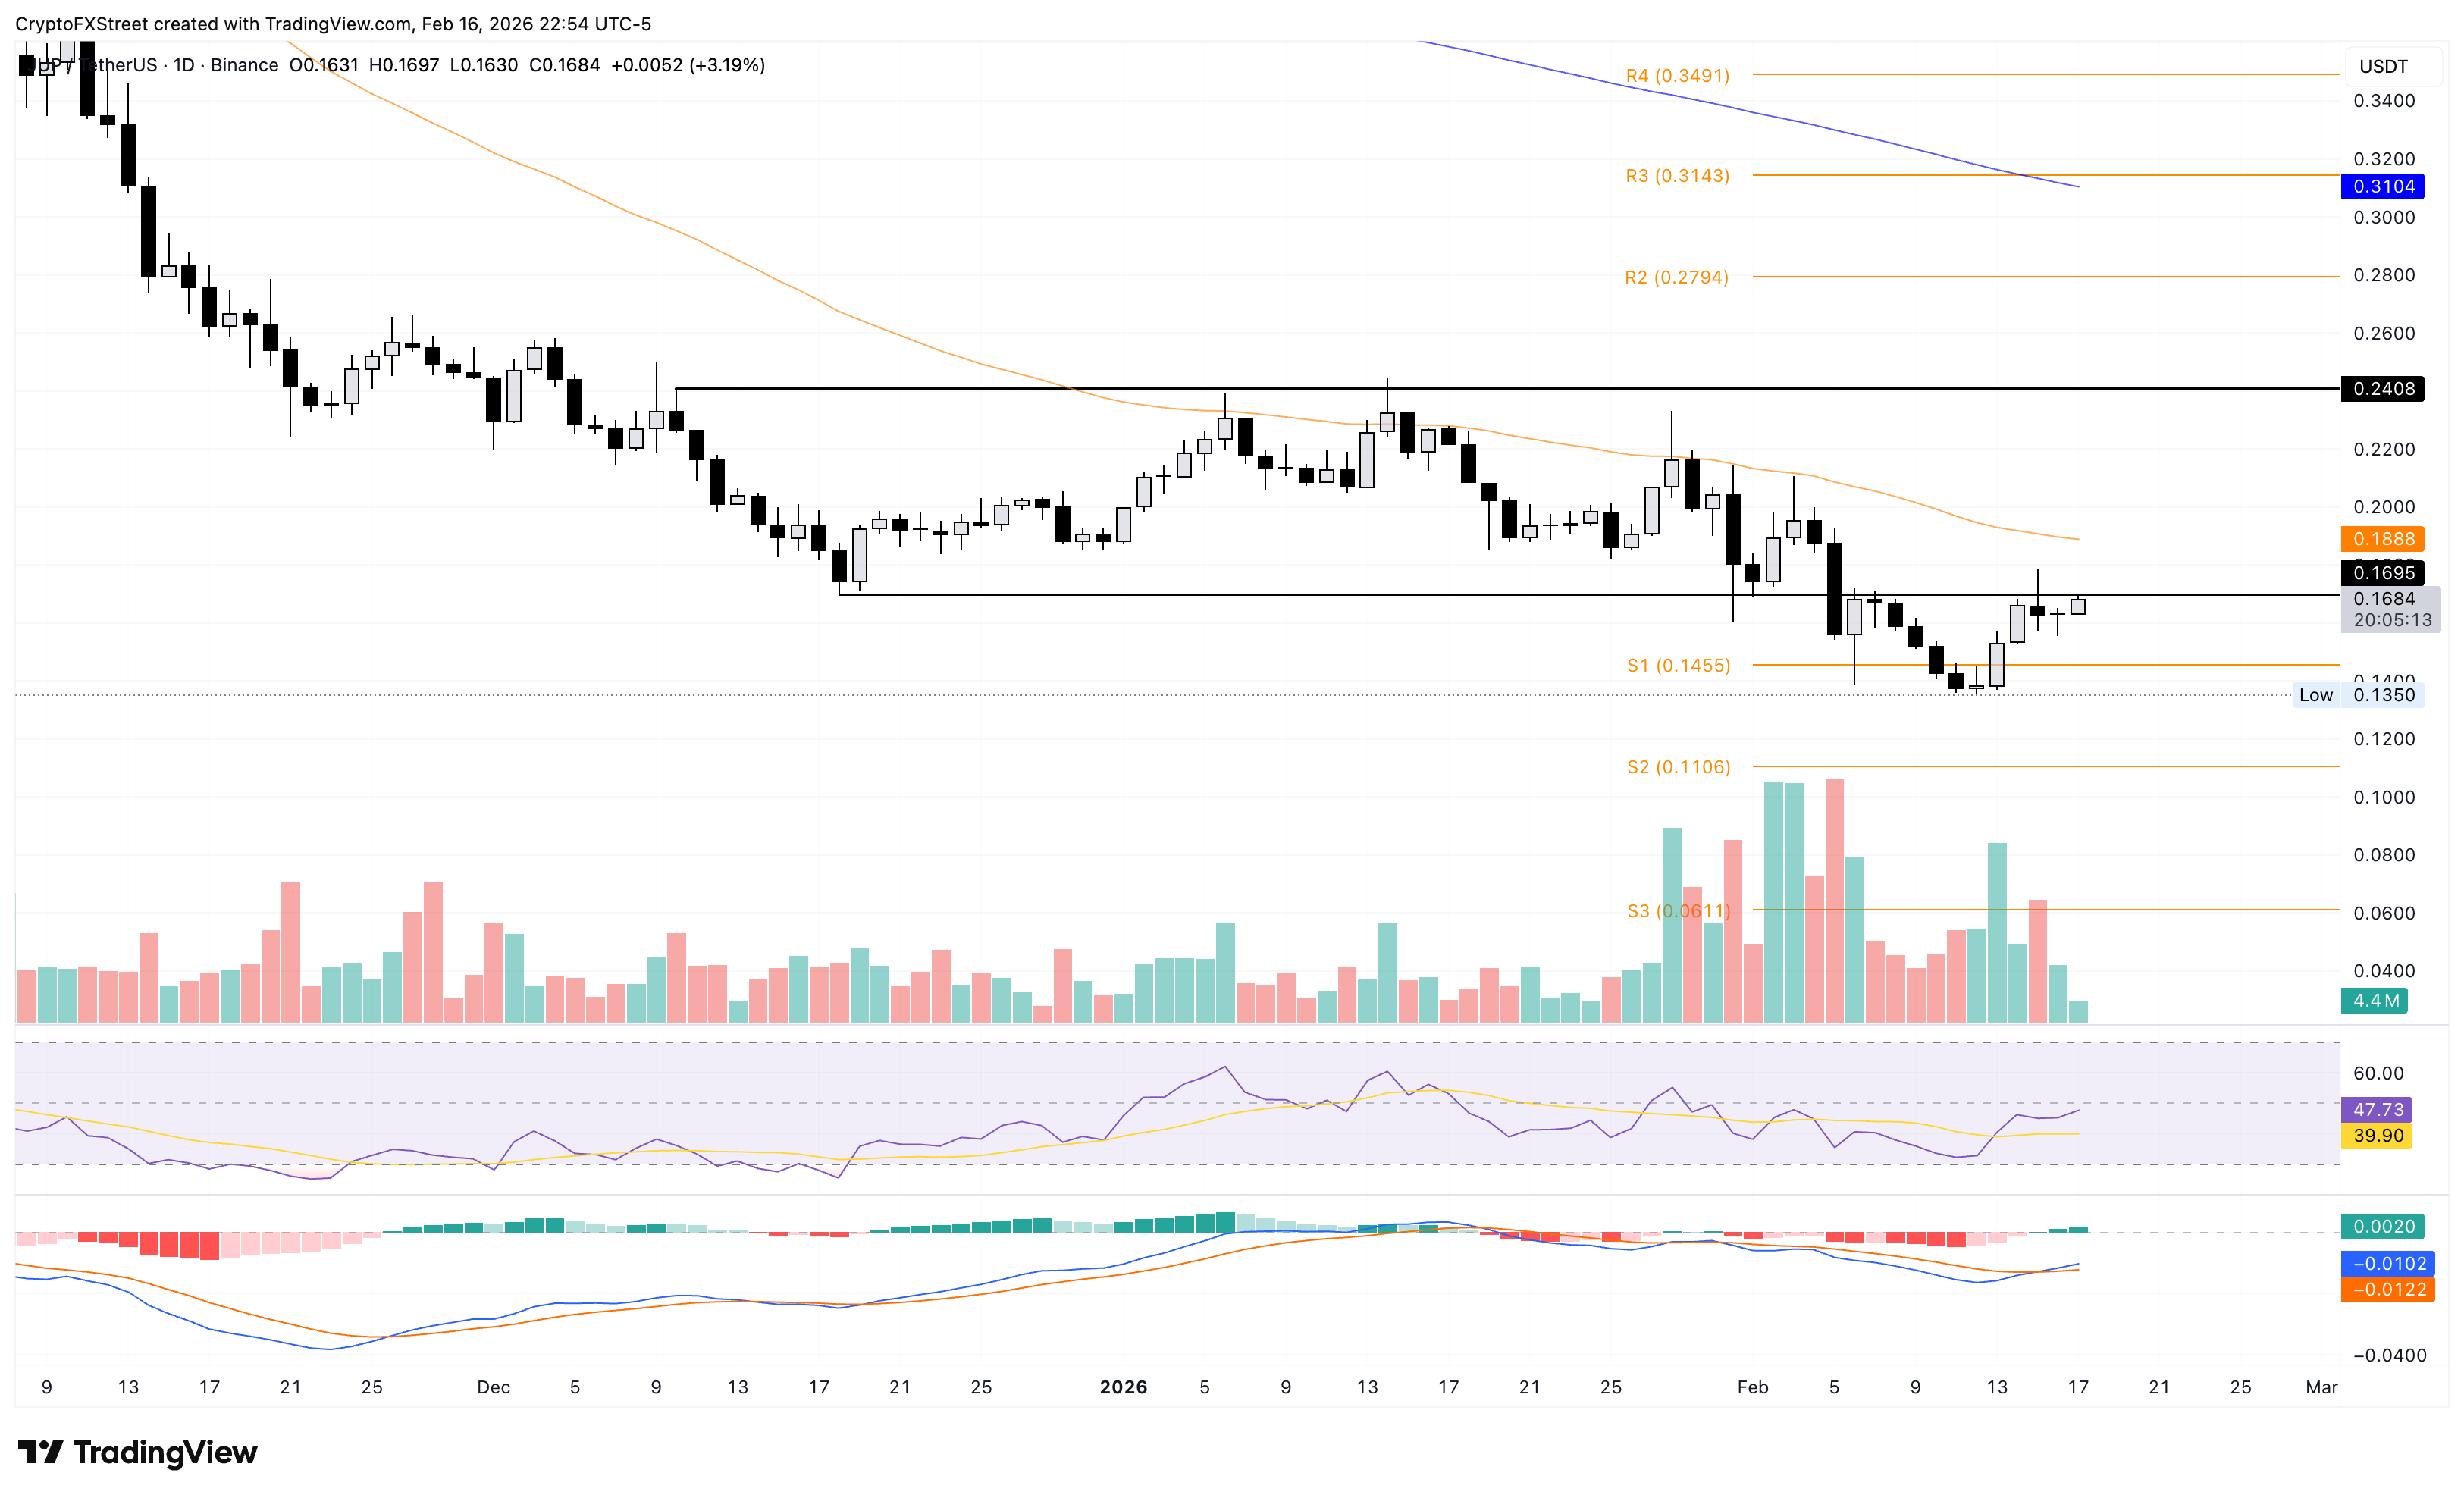
On the downside, a bearish close to the day would cap upside pressure and could extend the decline to the S1 Pivot Point at $0.1455.
Author

Vishal Dixit
FXStreet
Vishal Dixit holds a B.Sc. in Chemistry from Wilson College but found his true calling in the world of crypto.




