Investors won’t be happy with this Shiba Inu price move
- Shiba Inu price is consolidating above stable support at $0.0000095.
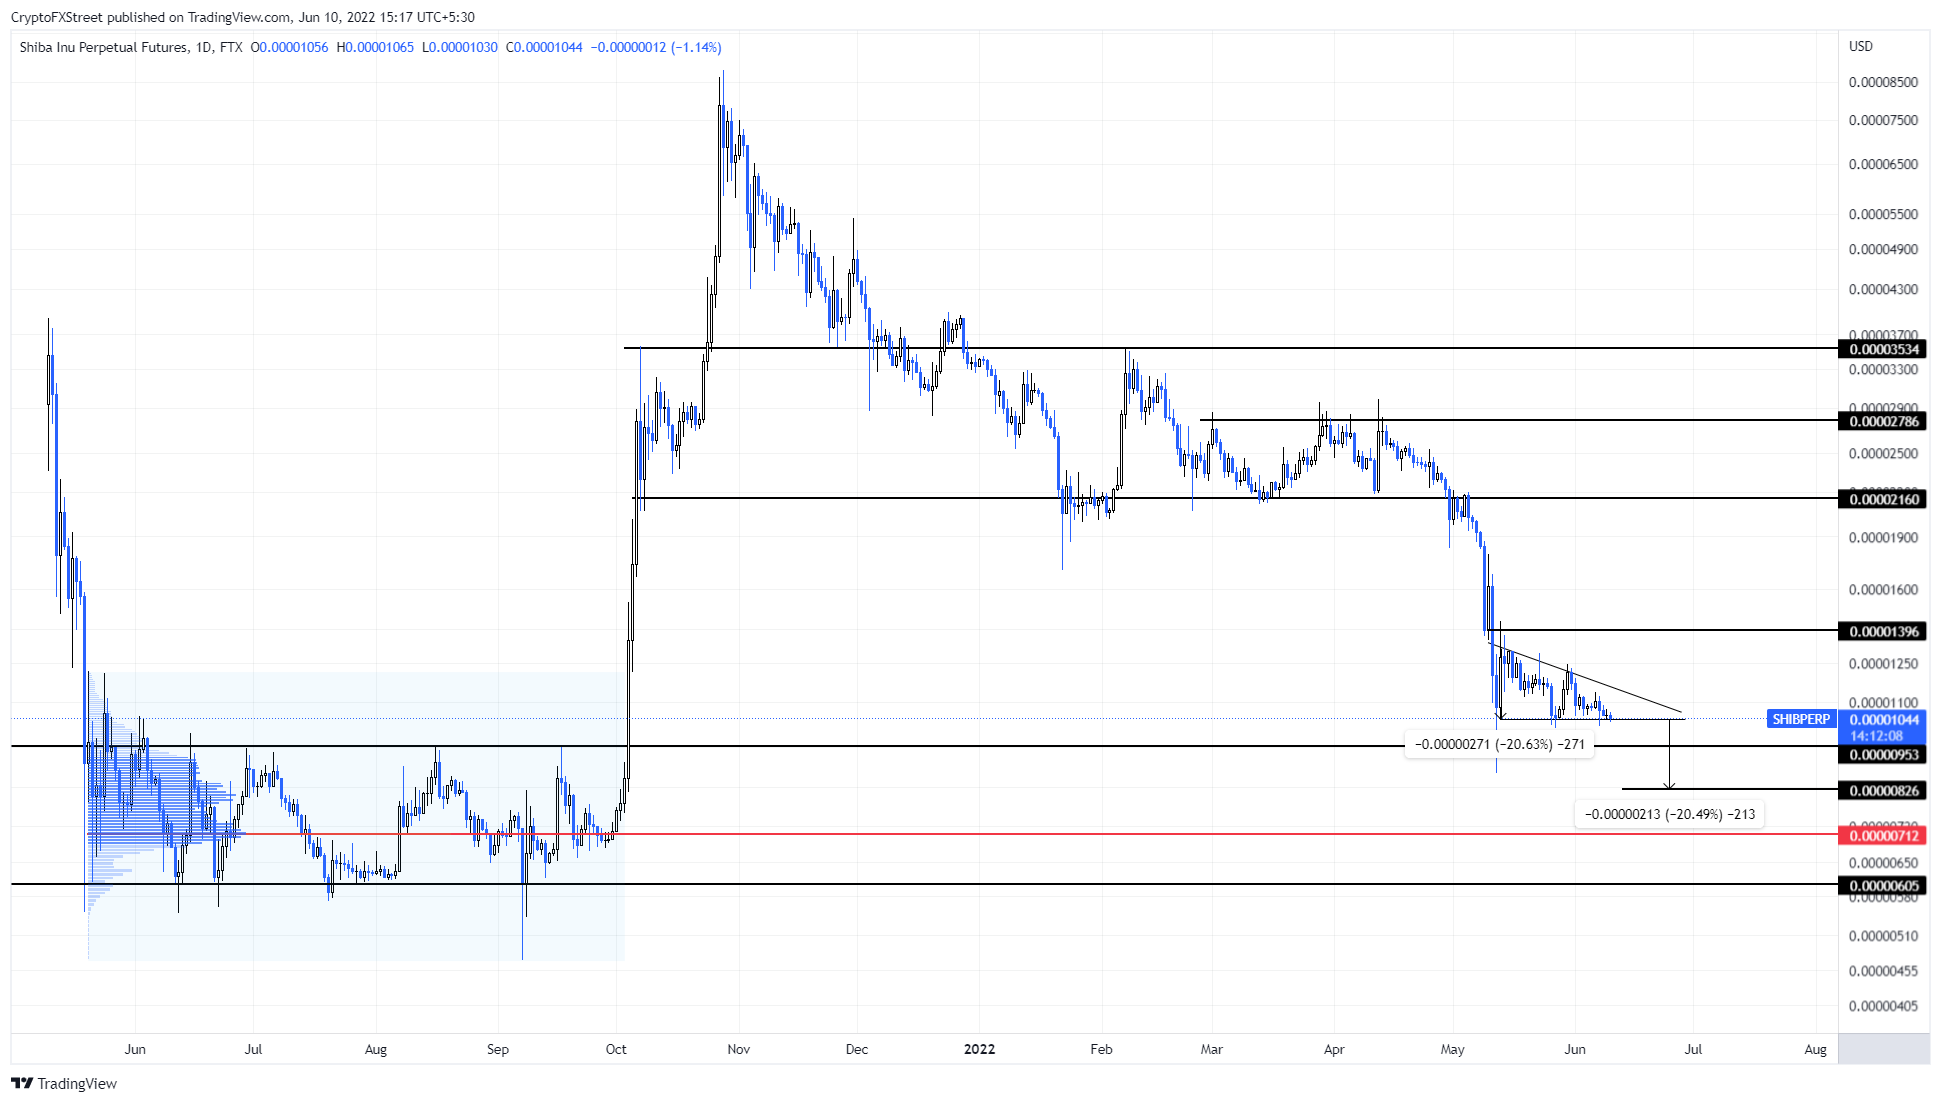
- The descending triangle forecasts a 20% crash to $0.0000082.
- A daily candlestick close above the $0.0000139 hurdle will invalidate the bullish thesis.

Shiba Inu price is trading in a tight range above a higher time frame foothold without yet retesting it. If sellers take control, however, and puncture below it, a massive sell-off is likely to take place.
Shiba Inu price reveals mixed signals
Shiba Inu price has crashed 90% from its all-time high, creating a swing low at $0.0000087 on May 12. Since this point, SHIB has recovered to $0.0000143 and has produced four lower highs and three equal lows.
Connecting these swing points reveals a descending triangle, forecasting a 20% crash to $0.0000082. The target is obtained by measuring the distance between the first swing high and low from the breakout point at $0.0000101.
The higher time frame support level at $0.0000095, however, is going to hinder sellers and their plans and short-sellers need to wait for a confirmation that adds to their bearish thesis.
From a macro perspective, the crash is unlikely to stop at $0.0000082 but extend lower. The consolidation that took place between May 2021 and September 2021 shows a volume point of control at $0.0000071, which will be the next support level that will absorb the incoming selling pressure, and thereby pausing the Shiba Inu price rally.
SHIB/USDT 4-hour chart
On the other hand, if Shiba Inu price produces a daily candlestick close above the descending triangle’s hypotenuse, it will trigger a bullish breakout. In this case, SHIB needs to climb past the $0.0000139 resistance barrier.
Flipping this hurdle into a support level will clearly invalidate the bearish thesis for Shiba Inu price.
Author

Akash Girimath
FXStreet
Akash Girimath is a Mechanical Engineer interested in the chaos of the financial markets. Trying to make sense of this convoluted yet fascinating space, he switched his engineering job to become a crypto reporter and analyst.



