How ready is Cardano price to revisit $1.7 after recent flash crash
- Cardano price slowly struts higher to complete the inverse head-and-shoulder pattern.
- From the current position, ADA provides an opportunity to capitalize on an 80% move.
- A daily candlestick close below $0.85 will invalidate the bullish thesis.

Cardano price is forming a bottom reversal pattern that could pull it from the multi-month downtrend and kick-start a bull rally. However, ADA bulls have their own set of hurdles to overcome for such a bullish outcome.
Cardano price heads toward a bullish future
Cardano price action since January 21 seems to be hinting at the formation of an inverse head-and-shoulder pattern. The technical formation contains three distinctive valleys. The one in the middle is typically deeper than the other two and forms the “head.” The slightly lower valleys on either side of almost equal height, create the “shoulders.” Hence the namesake “head-and-shoulders.”
Connecting the peaks of these valleys using a trend line reveals a resistance barrier known as the “neckline” at $1.26.
Investors should note that a decisive close above $1.26 will signal a breakout. However, the said pattern is not complete unless ADA retests the neckline. Therefore, a reversal in trend could snuff out the possibility of an upswing.
Regardless, if Cardano price continues to head higher, the head-and-shoulders pattern will be confirmed. A daily candlestick close above $1.26 will confirm a breakout. In such a case, the $1.70 target is determined by measuring the 36% distance between the head’s lowest point to the neckline, and adding that to the breakout point.
However, the run-up will not be a cakewalk as ADA will also face massive headwinds around the 2022 volume point of control at $1.05. The point on control is a place where ADA volume traded in 2022 was the highest. Overcoming this blockade will be the first test of the bulls’ strength. Clearing this ceiling will allow ADA to push through the $1.22 to $1.35 hurdle and make a run at the forecasted target at $1.70, bringing the total gain to 83%.
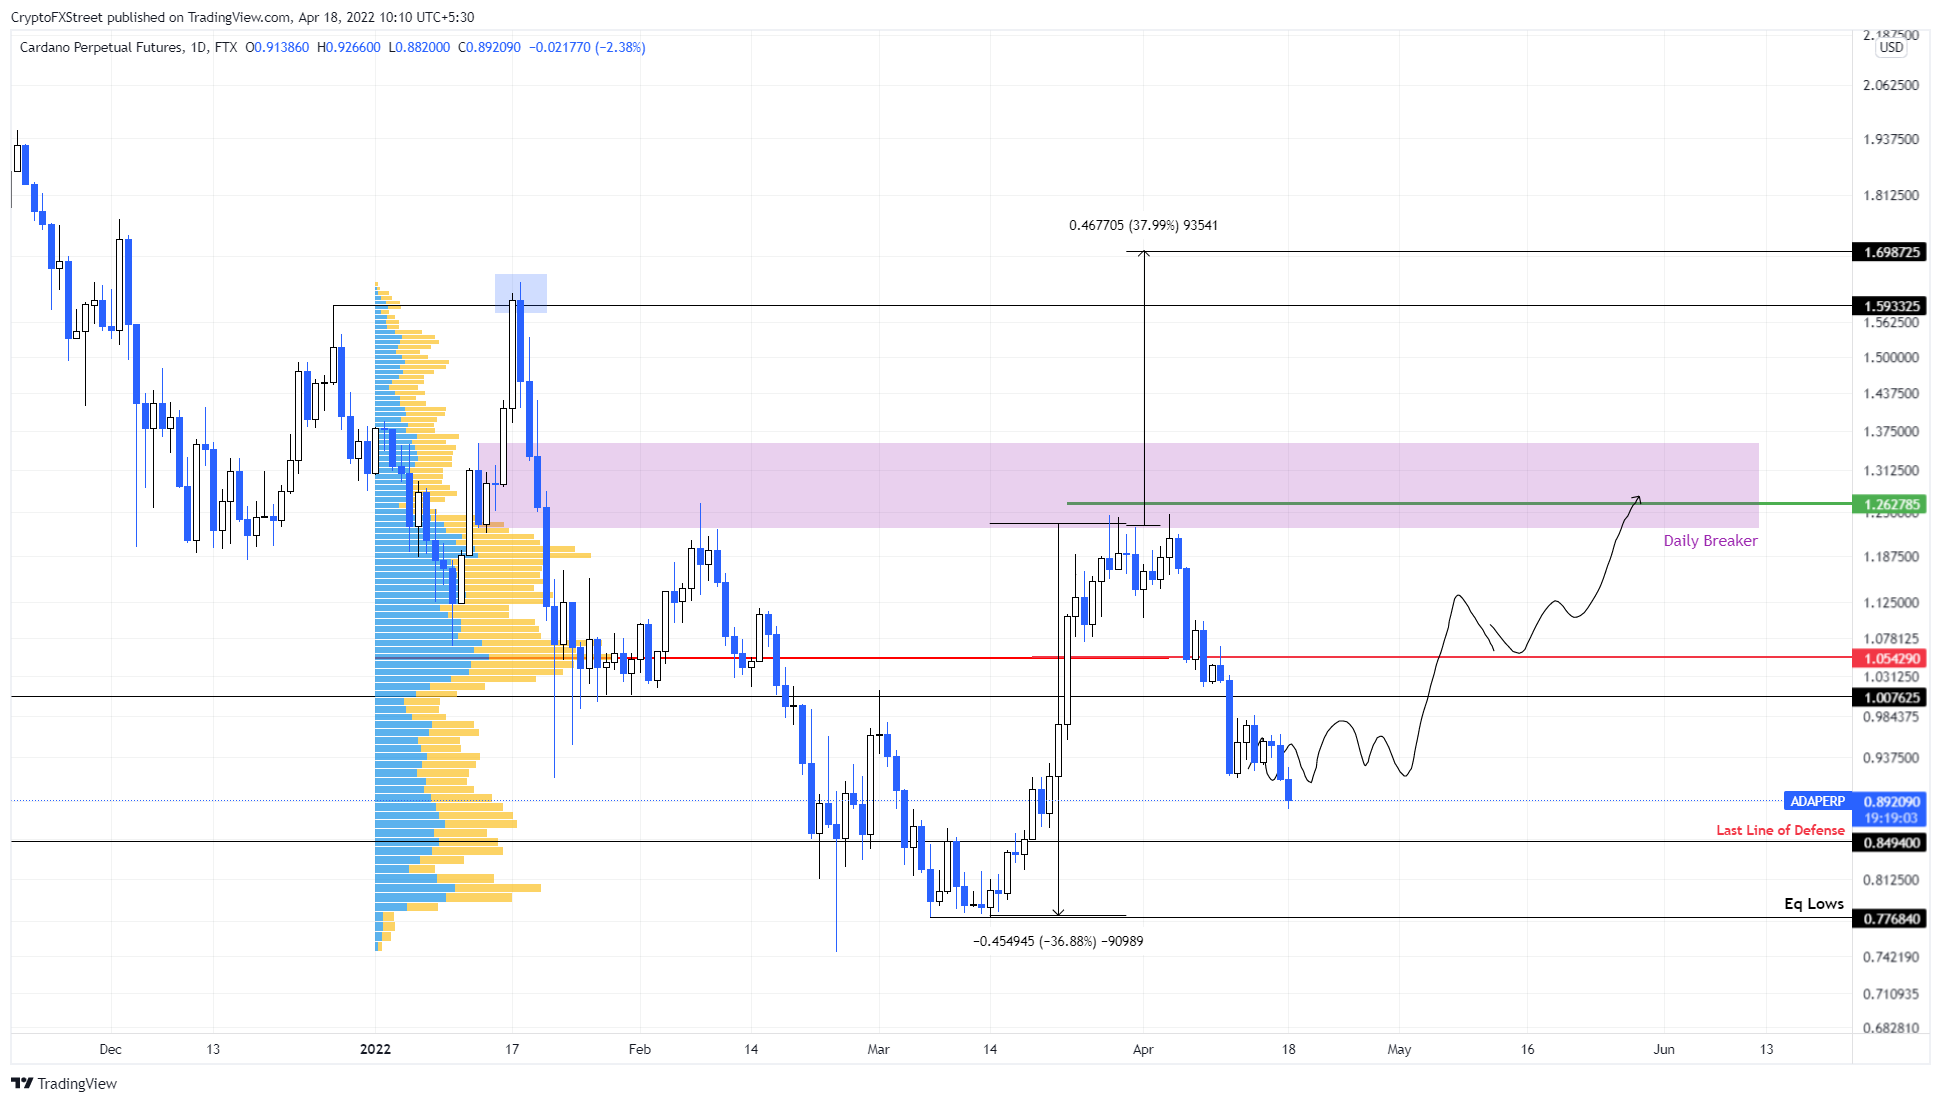
ADA/USDT 1-day chart
Supporting this massive upswing position for Cardano price is the 365-day Market Value to Realized Value (MVRV) model. This on-chain metric is used to determine the average profit/loss of investors that purchased ADA over the past year.
A value below -10% indicates that short-term holders are at a loss and are less likely to sell, which is where long-term holders tend to accumulate. Hence, any move below -10% is termed an “opportunity zone.”
For ADA, the 365-day MVRV has stayed in the negative territory since December 1, 2021, indicating the massive oversold condition of the altcoin. Therefore, investors can expect long-term holders to be accumulating.
In such a case, the inverse head-and-shoulders pattern could be the metaphorical valve that kick-starts a massive move to the upside.
 [08.17.52, 18 Apr, 2022]-637858537392114238.png)
ADA 365-day MVRV
On the other hand, a headwind that pushes Cardano price to reverse the trend will put the potential gains in jeopardy. A daily candlestick close below $0.85 will invalidate the bullish thesis by producing a lower low.
In such a case, ADA could crash to $0.77 before stabilizing and rethinking the directional bias.
Author

Akash Girimath
FXStreet
Akash Girimath is a Mechanical Engineer interested in the chaos of the financial markets. Trying to make sense of this convoluted yet fascinating space, he switched his engineering job to become a crypto reporter and analyst.


