Hedera price may avoid a 25% decline as Hedera Hashgraph v0.46 goes live on testnet
- Hedera price formed a head and shoulders pattern, nearly falling through half of the target decline of 25%.
- Hedera Hashgraph testnet just underwent the v0.46 upgrade, which has been highly anticipated following the successful v0.45 upgrade.
- This testnet release could act as a catalyst for recovery, as HBAR has already climbed by more than 5% in the last 24 hours.
Hedera price is in the midst of either confirming or rejecting a bearish reversal pattern that could have a considerable effect on the altcoin. The saving grace, however, is the most recent upgrade at the moment, which, too, is likely failing to catalyze a rally.
Hedera Testnet upgrade goes live
Hedera Hashgraph, the parent chain of the HBAR token, recently deployed the next key upgrade to its testnet, v0.46. The upgrade went live on January 23, making it the second network upgrade this month alone.
At the beginning of January, the v0.45 upgrade was deployed on the mainnet following a successful testnet run-through from December 28. With the v0.46 testnet upgrade going live on January 23, the main net will likely receive this upgrade in the next 11 days, i.e., February 5.
This could also be a huge catalyst in saving the altcoin from witnessing a considerable drawdown.
Hedera price under threat
Hedera price, trading at $0.072 at the time of writing, is recovering after bouncing back from the support line marked at $0.068. The altcoin had almost confirmed a bearish outlook, which is denoted by the head and shoulders pattern.
The head and shoulders pattern is a reversal pattern, indicating a likely reversal in the prevailing trend. This pattern manifests as three distinctive peaks: a pinnacle peak (referred to as the head) sandwiched between two lower peaks (resembling shoulders). The initial shoulder emerges during an uptrend, succeeded by a higher peak constituting the head, followed by a lower peak finalizing the second shoulder.
The significance of head and shoulders lies in their indication of a shift from bullish to bearish sentiment. A connecting neckline links the lows of these peaks. A confirmed breach beneath this neckline serves as a powerful signal, suggesting a potential onset of a downtrend.
In the case of HBAR, this nearly occurred when the altcoin fell through the support block of $0.073 to $0.075. According to the pattern, the target price is marked at $0.055, signifying a potential 25% correction from the neckline. But before the altcoin could reach this price level, it bounced back from $0.068.
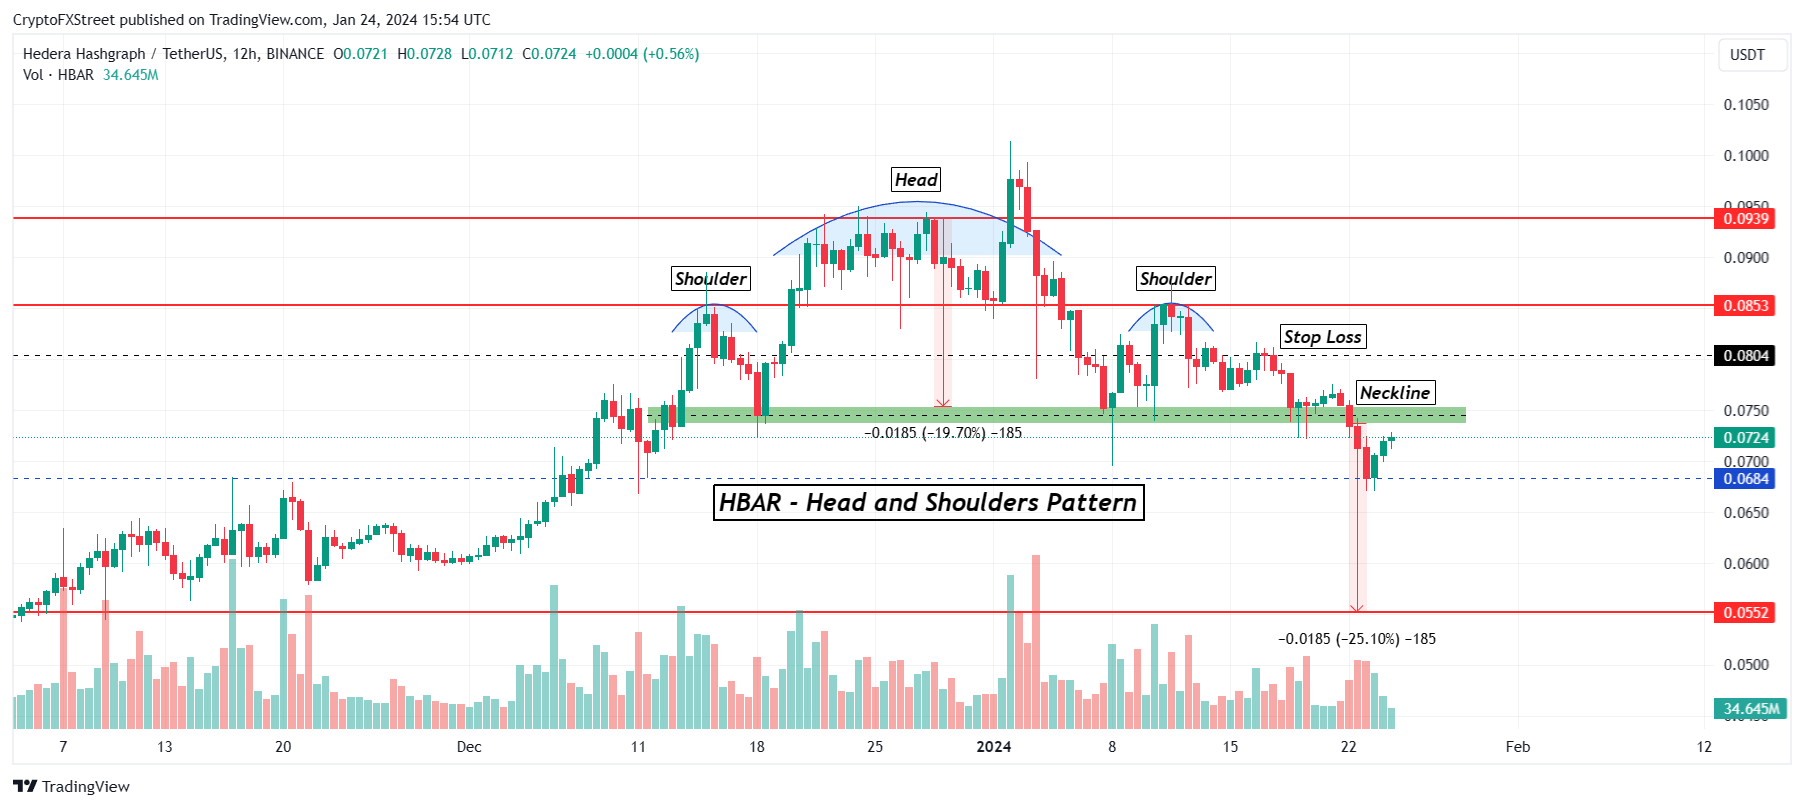
HBAR/USDT 12-hour chart
However, since the broader market cues are still bearish, a decline is still likely. Failure to breach the $0.073 resistance will result in a decline again, and Hedera price falling to $0.055 would confirm the pattern as well.
But if the bulls take the charge and breach the resistance level, it could flip it into a support floor. Once HBAR, with this boost, breaches the $0.080 mark, the bearish thesis will be invalidated.
Author

Aaryamann Shrivastava
FXStreet
Aaryamann Shrivastava is a Cryptocurrency journalist and market analyst with over 1,000 articles under his name. Graduated with an Honours in Journalism, he has been part of the crypto industry for more than a year now.


