Hedera Hashgraph Technical Analysis: HBAR/USD up 12%, sees an increase in trading volume
- HBAR/USD has positioned itself in the top 40 coins on the cryptocurrency ladder by market cap.
- Hedera was inside a daily downtrend before the explosive move on June 18.

HBAR/USD is up by more than 22% since June 15, after bulls managed to climb above the daily 26-EMA and the 12-EMA. The massive surge was accompanied by a significant increase in trading volume too.
HBAR/USD daily chart
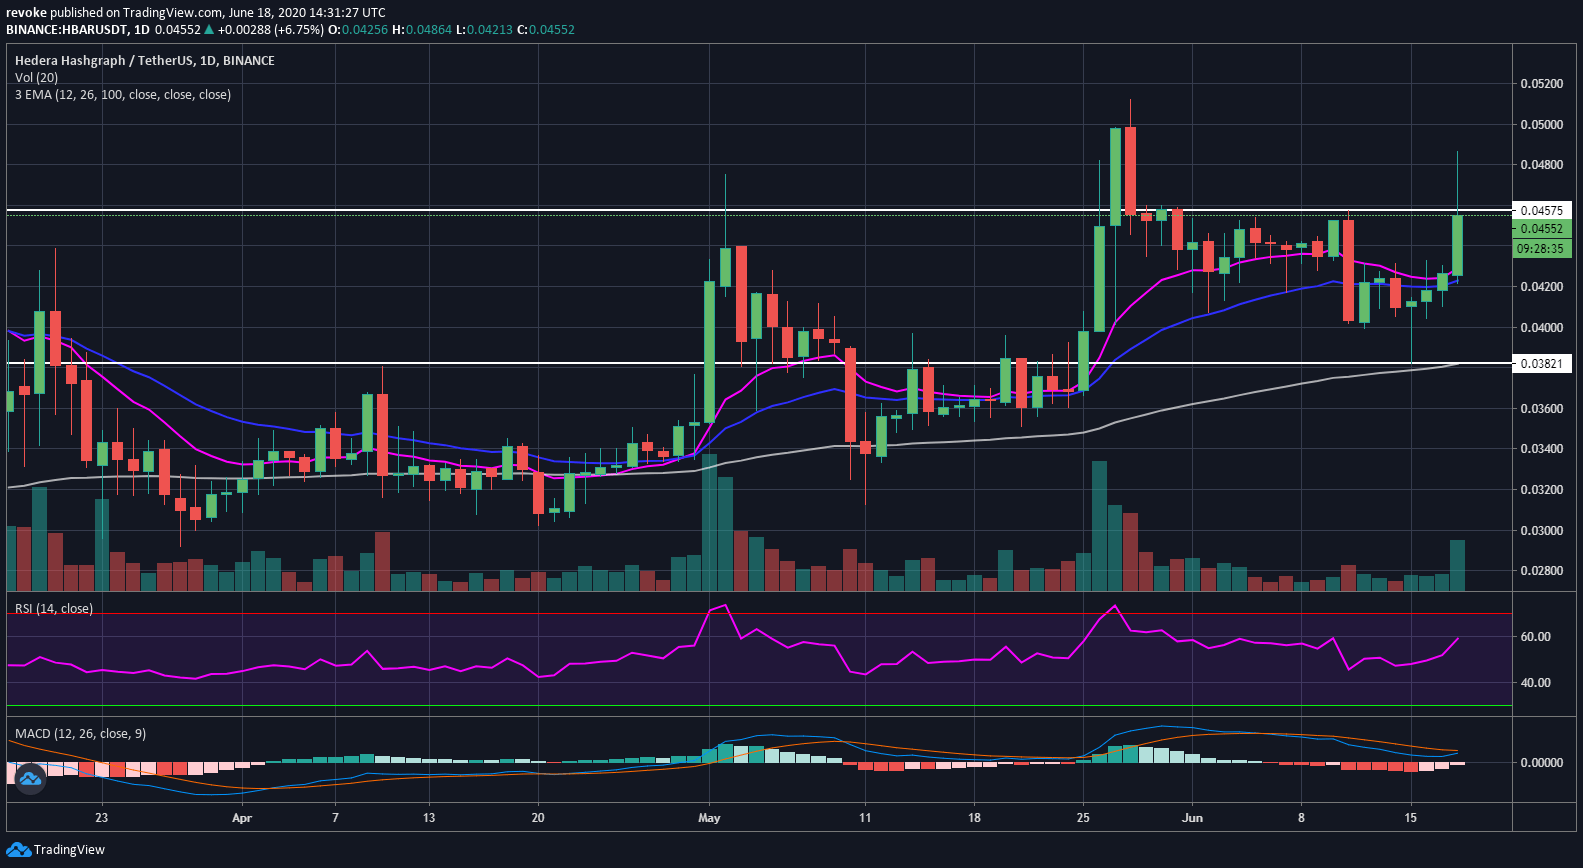
Hedera is now facing the $0.0475 resistance point set on May 2 and the daily high at $0.0512. The daily RSI is not overextended and the MACD is on the verge of a bull cross, probably happening in the next 24 hours if the bulls can keep up with the pace. HBAR is comfortably trading above the 12-EMA and the 26-EMA and will use them as support levels if we see a pullback.
HBAR/USD 4-hour chart
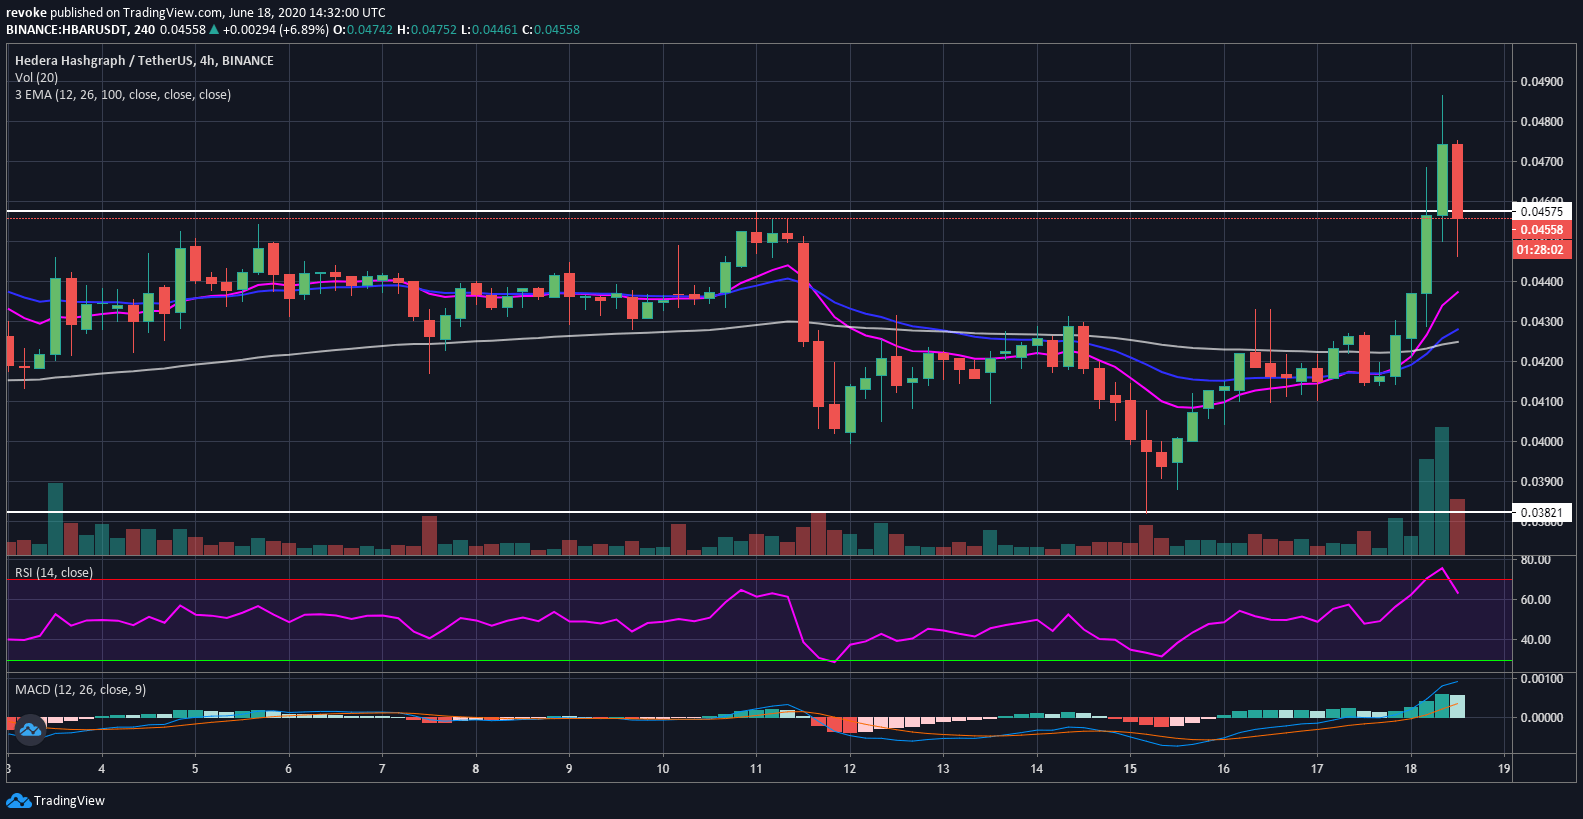
It’s clear that the bull move is not just one whale buying a lot of coins as it happened over the last 16 hours. HBAR crossed above the 100-EMA and the 12 and 26-EMAs as well and had a lot of continuation with increasing bull volume. The RSI is overextended and it could indicate a pullback.
Author

Lorenzo Stroe
Independent Analyst
Lorenzo is an experienced Technical Analyst and Content Writer who has been working in the cryptocurrency industry since 2012. He also has a passion for trading.


